China tea exports by province: Zhejiang, Anhui and Hunan
China tea exports by province: Zhejiang shipped 185,297 t in 2025, 44.2% of the total, ahead of Anhui and Hunan. Volume, value and unit value, 2015–2025.
Key facts
- Zhejiang exported 185,297 tonnes of tea worth US$560.0 million in 2025, 44.2% of China's tea export volume, according to MOFCOM (share: The Tea Trade's calculation).
- Zhejiang, Anhui and Hunan were the first, second and third Chinese provinces by tea export volume every year from 2015 to 2025, and shipped 75.1% of China's 418,757 tonnes in 2025, according to The Tea Trade's calculation from MOFCOM's December reports.
- Fujian was the first Chinese province by tea export value in 2021 and 2022, with US$531.5 million in 2022, but exported US$169.7 million in 2025, third behind Zhejiang and Anhui, according to MOFCOM.
- Hubei's tea exports more than tripled between 2015 and 2025, from 9,398 to 30,809 tonnes, and overtook Fujian's in volume in 2024, according to MOFCOM's December reports.
- More than two-thirds of the raw tea in Zhejiang's tea exports comes from other provinces, according to the Zhejiang Agricultural Foreign Cooperation Centre (2020), so a province's export figure is not a measure of the tea grown there.
Zhejiang exported 185,297 tonnes of tea in 2025, 44.2% of China’s 418,757 tonnes, ahead of Anhui (73,491 t) and Hunan (55,668 t), according to the province table in the monthly tea export report of China’s Ministry of Commerce (MOFCOM); together the three shipped 75.1% of the volume (The Tea Trade’s calculation). By value, Fujian came third, with US$169.7 million at US$8.14 per kg, against US$3.02 per kg for Zhejiang (unit values: The Tea Trade’s calculation). Zhejiang, Anhui and Hunan have held the first three places by volume every year since 2015, but a province in these figures is not where the tea was grown: more than two-thirds of the raw tea in Zhejiang’s exports comes from other provinces, according to a Zhejiang provincial agency.
China tea exports by province in 2025
MOFCOM’s December report, published with China’s chamber of commerce for foodstuffs and native produce (中国食品土畜进出口商会), covers the full year. Its province table (分省市出口情况) lists ten provinces, ranked by export value. In 2025 they shipped 95.3% of China’s tea export volume and 94.4% of its value; all the other provinces together shipped 19,646 tonnes worth US$86.7 million (The Tea Trade’s calculation).
China’s tea exports by province, 2025: the ten provinces in MOFCOM’s table, ranked by value (source: MOFCOM; unit values and shares: The Tea Trade’s calculation)
| Rank by value | Province | Volume (t) | Volume change | Value (US$ million) | Value change | Unit value (US$/kg) | Share of China’s volume |
|---|---|---|---|---|---|---|---|
| 1 | Zhejiang (浙江) | 185,297 | +18.4% | 560.0 | +18.7% | 3.02 | 44.2% |
| 2 | Anhui (安徽) | 73,491 | +7.8% | 280.7 | +12.9% | 3.82 | 17.5% |
| 3 | Fujian (福建) | 20,847 | −0.1% | 169.7 | −6.5% | 8.14 | 5.0% |
| 4 | Hunan (湖南) | 55,668 | +14.6% | 155.8 | +12.9% | 2.80 | 13.3% |
| 5 | Hubei (湖北) | 30,809 | +9.2% | 115.5 | −3.6% | 3.75 | 7.4% |
| 6 | Jiangxi (江西) | 11,753 | +2.2% | 60.5 | −5.9% | 5.15 | 2.8% |
| 7 | Guangdong (广东) | 4,332 | +13.8% | 33.8 | +29.1% | 7.80 | 1.0% |
| 8 | Guizhou (贵州) | 4,787 | −4.2% | 31.6 | −9.7% | 6.60 | 1.1% |
| 9 | Henan (河南) | 7,773 | +9.8% | 29.4 | −18.8% | 3.79 | 1.9% |
| 10 | Shaanxi (陕西) | 4,356 | +117.9% | 22.1 | +91.9% | 5.07 | 1.0% |
Changes are on 2024, as published by MOFCOM. Unit value = value ÷ volume.
By volume, the order is Zhejiang, Anhui, Hunan, Hubei and Fujian: the provinces outside the table shipped less between them than Fujian alone. Zhejiang carried the year’s growth, adding 28,799 tonnes, 64.5% of China’s increase of 44,639 tonnes over 2024 (The Tea Trade’s calculation). Shaanxi entered the table, with 4,356 tonnes, more than twice its 2024 volume.
In the table, unit values range from US$2.80 per kg for Hunan to US$8.14 for Fujian. Zhejiang, Hunan, Hubei, Henan and Anhui shipped at US$2.80 to US$3.82 per kg, around China’s average of US$3.69; Jiangxi and Shaanxi at about US$5; Fujian, Guangdong and Guizhou, with much smaller volumes, at US$6.60 to US$8.14. These are customs unit values, the declared free-on-board value divided by the quantity: they mix tea types, grades and pack sizes, and are not the price of any particular tea. China’s 2025 figures by tea type and destination are in our guide to China’s 2025 tea exports.
What “province” means in China’s tea export statistics
China’s customs statistics record two places in China for each export, and figures by province can be compiled from either. One is the exporter. Under the Customs Statistics Regulations (海关统计条例, article 10), the consignor (收发货人) is recorded as the legal person, organisation or individual carrying out the export, and the National Bureau of Statistics (NBS) places it in the province where it is registered with customs. The other is the domestic source of the goods (境内货源地), which article 9 requires for every export: the province where the goods were produced or from which they were first dispatched, in the NBS’s definition. China Customs described it to a United Nations statistics workshop in 2017 in the same terms.
MOFCOM’s report does not say which of the two its table uses. The column is headed only 地区 (region), and the report’s notes (报告说明), where there are any, list nothing but the eight-digit customs codes it counts as tea. None of the eleven December reports from 2015 to 2025 defines the province (checked October 2026).
Provincial authorities quote the same figures as MOFCOM. Changsha Customs put Hunan’s 2024 tea exports at 49,000 tonnes, up 15.2%; MOFCOM’s table shows 48,556 tonnes, up 15.2%. An article published by Hubei’s commerce department gave 18,300 tonnes for 2020, up 5.4% and 5.3% of China’s volume, as in MOFCOM’s table (18,352 t), and the Zhejiang Daily gave 185,000 tonnes worth US$560 million for Zhejiang in 2025. One figure does not match: for 2019, the Zhejiang Agricultural Foreign Cooperation Centre gave 165,000 tonnes, 45.1% of China’s volume, while MOFCOM’s table shows 158,775 tonnes (43.3%, The Tea Trade’s calculation). The centre did not say which series it used.
Either way, a province’s export figure is not the tea grown there. More than two-thirds of the raw tea for Zhejiang’s exports comes from other provinces, the same centre wrote in 2020. In 2025 Zhejiang exported 185,000 tonnes of tea, while its own tea gardens produced 214,000 tonnes, according to the Zhejiang Daily. Output by province is covered in our guide to China’s tea production in 2025.
Tea exports by province, 2015–2025
MOFCOM’s December reports give a ten-year series. From 2015 to 2019 they listed 27 to 30 provinces and regions a year, adding up to China’s total; since 2020 they list ten provinces, ranked by value, always including the five below.
Tea export volume, 2015–2025, of the five largest exporting provinces in 2025 (tonnes; source: MOFCOM December reports; share: The Tea Trade’s calculation)
| Year | Zhejiang | Anhui | Hunan | Hubei | Fujian | China | Share of Zhejiang, Anhui and Hunan |
|---|---|---|---|---|---|---|---|
| 2015 | 157,723 | 56,563 | 35,579 | 9,398 | 17,269 | 324,956 | 76.9% |
| 2016 | 147,223 | 56,761 | 34,828 | 11,468 | 19,584 | 328,694 | 72.7% |
| 2017 | 162,943 | 59,702 | 37,528 | 13,116 | 19,510 | 355,252 | 73.2% |
| 2018 | 168,469 | 59,172 | 36,351 | 12,168 | 24,098 | 364,742 | 72.4% |
| 2019 | 158,775 | 60,022 | 39,011 | 17,417 | 23,994 | 366,528 | 70.3% |
| 2020 | 146,168 | 66,417 | 35,495 | 18,352 | 22,005 | 348,814 | 71.1% |
| 2021 | 150,810 | 67,738 | 41,557 | 23,521 | 26,148 | 369,355 | 70.4% |
| 2022 | 153,789 | 62,078 | 47,636 | 24,534 | 31,837 | 375,255 | 70.2% |
| 2023 | 150,290 | 67,266 | 42,157 | 24,190 | 28,889 | 367,542 | 70.7% |
| 2024 | 156,499 | 68,178 | 48,556 | 28,218 | 20,875 | 374,118 | 73.0% |
| 2025 | 185,297 | 73,491 | 55,668 | 30,809 | 20,847 | 418,757 | 75.1% |
China’s totals for 2020 to 2025 are the sum of MOFCOM’s figures by tea type, since its overviews round them.
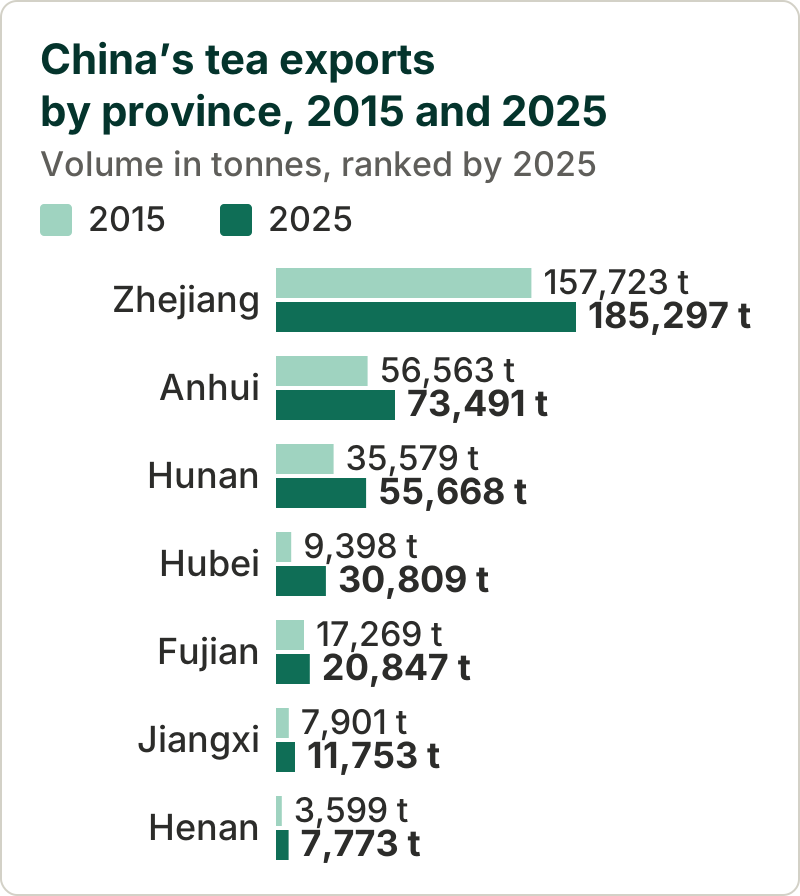 Source: MOFCOM, December reports for 2015 and 2025
Zhejiang’s share of China’s volume fell from 48.5% in 2015 to 40.8% in 2021, then rose back to 44.2% in 2025; the three largest provinces together shipped between 70.2% (2022) and 76.9% (2015) of the volume each year. Growth was uneven. Between 2015 and 2025 China’s tea exports grew 28.9%; Zhejiang’s grew 17.5%, Fujian’s 20.7%, Anhui’s 29.9% and Hunan’s 56.5%, while Hubei’s more than tripled (+227.8%) and overtook Fujian’s in 2024. Of the 93,801 extra tonnes China exported in 2025 compared with 2015, Zhejiang added 27,575, Hubei 21,412, Hunan 20,088 and Anhui 16,928. Shares, growth rates and differences in this paragraph are The Tea Trade’s calculation from MOFCOM’s figures. How the destinations of this tea changed over the same decade is set out in our guide to China’s tea export markets, 2015–2025.
The complete lists of 2015 to 2019 also show Shanghai, fifth by volume in 2015 and 2016, with 10,927 and 12,186 tonnes; it shipped 7,756 tonnes in 2019 and has not appeared in a full-year top ten by value since.
Export value and unit value by province
Tea export value of the main exporting provinces, 2015–2025 (US$ million; source: MOFCOM December reports)
| Year | Zhejiang | Anhui | Fujian | Hunan | Hubei | Guizhou | China |
|---|---|---|---|---|---|---|---|
| 2015 | 519.7 | 227.0 | 173.8 | 91.6 | 79.1 | 22.5 | 1,381.6 |
| 2016 | 461.7 | 242.8 | 219.5 | 91.3 | 113.3 | 19.8 | 1,484.9 |
| 2017 | 494.4 | 235.2 | 239.0 | 93.2 | 123.9 | 24.7 | 1,609.6 |
| 2018 | 523.1 | 246.6 | 346.0 | 95.3 | 145.2 | 23.7 | 1,777.9 |
| 2019 | 483.7 | 248.1 | 455.3 | 103.3 | 214.4 | 48.0 | 2,019.5 |
| 2020 | 447.2 | 280.0 | 417.7 | 98.6 | 201.3 | 103.6 | 2,038.1 |
| 2021 | 485.9 | 287.4 | 513.1 | 124.2 | 189.6 | 222.2 | 2,299.2 |
| 2022 | 483.6 | 245.0 | 531.5 | 140.3 | 199.6 | 85.1 | 2,082.7 |
| 2023 | 464.5 | 250.1 | 305.6 | 116.4 | 195.4 | 97.2 | 1,739.2 |
| 2024 | 471.7 | 248.6 | 181.4 | 138.1 | 119.8 | 35.0 | 1,419.3 |
| 2025 | 560.0 | 280.7 | 169.7 | 155.8 | 115.5 | 31.6 | 1,545.7 |
Zhejiang was first by value every year except 2021 and 2022, when Fujian came first with US$513.1 million and US$531.5 million. Fujian’s tea exports tripled in value between 2015 and 2022 on 17,000 to 32,000 tonnes a year, as its unit value rose from US$10.06 per kg to a peak of US$19.62 in 2021; in 2025 they were worth US$169.7 million, at US$8.14 per kg. Guizhou’s rose and fell more steeply: US$222.2 million in 2021 for 5,938 tonnes, or US$37.43 per kg, against US$31.6 million in 2025. Hubei’s value peaked at US$214.4 million in 2019 (US$12.31 per kg) and was US$115.5 million in 2025 (US$3.75 per kg). Unit values here are The Tea Trade’s calculation.
These provinces account for most of the fall in China’s tea export value after 2021. Between 2021 and 2025 the national total fell by US$753.5 million: Fujian’s exports by US$343.4 million, Guizhou’s by US$190.6 million, Hubei’s by US$74.2 million and Jiangxi’s by US$60.8 million, while Zhejiang’s rose by US$74.1 million and Hunan’s by US$31.6 million (The Tea Trade’s calculation). Over the whole decade, the unit values of Zhejiang, Anhui and Hunan stayed between US$2.48 and US$4.28 per kg.
The province table does not show where each province’s tea went. For Fujian, its commerce department reported that in 2020 the members of the Association of Southeast Asian Nations (ASEAN), Hong Kong, Japan and the United States took 90.9% of the province’s tea export value, ASEAN and Hong Kong alone RMB 2.30 billion of RMB 2.90 billion.
Which teas the main provinces export
MOFCOM reports tea types (green, black and speciality teas) and provinces in separate tables, never crossed. What is known of each province’s mix comes from the provinces’ own statements, made in different years.
What provincial authorities say about their tea exports (year of the data in brackets)
| Province | Teas | Markets | Source |
|---|---|---|---|
| Zhejiang | Green tea 92.1% of volume; gunpowder about 50% and chunmee about 30% of the green tea (2019) | Africa about 70%; Morocco more than a third of volume; the EU and the United States under 10% (2019) | Zhejiang Agricultural Foreign Cooperation Centre, 2020 |
| Fujian | Two-thirds of China’s oolong exports; first province for scented tea, second for black and other partly fermented tea after Guizhou, third for green tea after Zhejiang and Anhui (2020) | ASEAN, Hong Kong, Japan and the United States 90.9% of value (2020); other APEC economies 74.2% of value in January–September 2025 | Fujian Department of Commerce, 2022; Xiamen Customs, 2025 |
| Hubei | Green tea 84% of volume and black tea 13% (2017); green tea 86% of value (2020) | Hong Kong, Morocco, Malaysia and Germany, each over 1,000 tonnes (2017); Asia about 80% of value (2020) | Hubei Department of Commerce, via the Hubei Daily, 2018 and 2021; 2017 markets: China’s chamber of commerce for foodstuffs and native produce |
| Hunan | Black tea: Hunan says its export volume has been the largest of any province for several years (2025) | Not stated | Provincial tea-industry meeting, reported by the Hunan Daily, 2025 |
| Anhui | Not stated in the sources consulted | Not stated | – |
Zhejiang’s exports were mostly green tea for Africa in 2019, above all gunpowder and chunmee, shipped mainly to Morocco, Mauritania and Senegal, according to the Zhejiang centre. Fujian is the opposite case, a province of oolong, scented and black teas sold mainly in Asia, though its exports to Africa rose 34.5%, to RMB 200 million, in January–September 2025, according to Xiamen Customs as reported by the Fujian Daily. Hubei, like Zhejiang, shipped mainly green tea in 2017 and 2020.
Hunan’s statement on black tea comes without a figure, and MOFCOM’s data cannot test it. They do show that Hunan’s unit value, US$2.80 per kg in 2025, is the lowest in the province table, while China’s black tea exports averaged US$5.26 per kg. Fujian’s ranking of Guizhou ahead of itself for black and other partly fermented tea and Hunan’s claim may rest on different measures and years; neither source gives the numbers. For Anhui, second by volume and by value, no breakdown by tea type was found in the provincial sources consulted for this guide; its first markets in 2024 are shown below.
Which provinces supply Morocco, West Africa and Malaysia
The tea branch of the China Association for the Promotion of International Agricultural Cooperation (CAPIAC, 中国农业国际合作促进会) has published the first five provinces for five destinations in 2024, compiled from customs data. These are the association’s figures, not an official statistical release. Like MOFCOM, it does not say how a shipment is assigned to a province.
First three exporting provinces for five destinations, 2024 (US$ million; source: CAPIAC tea branch, an association, from customs data)
| Destination | First | Second | Third | Share of the first five provinces |
|---|---|---|---|---|
| Morocco | Zhejiang 150.0 | Hubei 39.7 | Hunan 21.7 | 94.88% |
| Ghana | Anhui 97.4 | Zhejiang 42.5 | Jiangxi 10.5 | 99.68% |
| Mauritania | Anhui 48.1 | Zhejiang 10.1 | Jiangxi 5.0 | 99.83% |
| Malaysia | Fujian 42.7 | Jiangxi 19.7 | Henan 11.7 | 84.05% |
| United States | Zhejiang 20.8 | Hunan 10.1 | Fujian 9.6 | 79.65% |
On CAPIAC’s figures, Anhui, not Zhejiang, was the first province for Ghana and Mauritania, where China’s tea exports were 99.92% and 100% green tea by volume in 2024. Zhejiang supplied about 62% of the value of China’s tea exports to Morocco, US$150 million of US$243 million (The Tea Trade’s calculation), and Fujian was first for Malaysia, where black tea was the largest type, at 43.74% of the volume (CAPIAC).
Provincial tea exports, January–April 2026
The most recent MOFCOM report that could be opened in October 2026 covers January to April 2026; the reports for May to September 2026 returned “not found”, and MOFCOM’s archive page for the series, dated 10 September 2026, lists none after April. Over those four months Zhejiang exported 61,937 tonnes (+6.9% year on year), 46.3% of China’s 133,896 tonnes (The Tea Trade’s calculation), Anhui 24,221 tonnes (+1.8%) and Hunan 16,386 tonnes (−16.2%). Hubei (−10.3%) and Fujian (−14.5%) also fell, and Shanghai reappeared in the top ten by value, with 1,186 tonnes.
How to read provincial tea export figures
- A province is not an origin. The figures place a shipment where its exporter is registered or where the goods were produced or first dispatched, and MOFCOM does not say which. Tea grown in one province is often exported from another. For protected names, see our guide to Chinese green tea geographical indications.
- Ten provinces only since 2020. The table ranks provinces by value, so a province that ships large volumes cheaply can fall outside it.
- Unit values are not prices. A province’s customs unit value reflects its mix of tea types, grades and packs. Compare like with like: the same province, tea type and year.
- State the series. Provincial agencies sometimes give figures that differ from MOFCOM’s for the same year, as Zhejiang’s centre did for 2019. Say which source and year a provincial figure comes from.
Questions and answers
Which Chinese province exports the most tea?
Zhejiang. It exported 185,297 tonnes of tea worth US$560.0 million in 2025, 44.2% of China's export volume (MOFCOM; share: The Tea Trade's calculation), and has been first by volume every year since 2015. Anhui (73,491 t) and Hunan (55,668 t) came next.
Do provincial export figures show where Chinese tea is grown?
No. Chinese customs can place an export in the province where the exporter is registered or where the goods were produced or first dispatched, and MOFCOM's table does not say which it uses. More than two-thirds of the raw tea in Zhejiang's exports comes from other provinces (Zhejiang Agricultural Foreign Cooperation Centre, 2020).
Which province exports the most valuable tea?
Per kilogram, Fujian, among the ten provinces in MOFCOM's 2025 table: its exports came to US$8.14 per kg, against US$3.69 for China as a whole (MOFCOM; unit value: The Tea Trade's calculation). Fujian ships two-thirds of China's oolong exports, according to its commerce department (2020 data). In total value, Zhejiang came first in 2025, with US$560.0 million.
How much tea does Anhui export?
73,491 tonnes worth US$280.7 million in 2025, up 7.8% in volume and 12.9% in value, second among China's provinces by volume and by value (MOFCOM). Anhui has been second by volume every year since 2015.
Which Chinese provinces export oolong and black tea?
Fujian ships two-thirds of China's oolong exports and ranked second for black and other partly fermented tea, after Guizhou, according to its commerce department (2020 data). According to the Hunan Daily, a provincial tea-industry meeting in June 2025 said Hunan's black tea export volume had been the largest of any province for several years, without giving a figure. MOFCOM's tea reports do not break tea types down by province.
Where can I find China's tea export statistics by province?
In MOFCOM's monthly tea report (中国出口月度统计报告 茶叶), section 分省市出口情况; the December issue covers the full year. Since 2020 it lists ten provinces, ranked by export value; the 2015 to 2019 issues listed every exporting province.
Sources
- 1. MOFCOM and 中国食品土畜进出口商会: China export monthly statistical report, tea, December 2025 (in Chinese) · wms.mofcom.gov.cn
- 2. MOFCOM and 中国食品土畜进出口商会: China export monthly statistical report, tea, December 2024 (in Chinese) · wms.mofcom.gov.cn
- 3. MOFCOM and 中国食品土畜进出口商会: China export monthly statistical report, tea, December 2023 (in Chinese) · wms.mofcom.gov.cn
- 4. MOFCOM and 中国食品土畜进出口商会: China export monthly statistical report, tea, December 2022 (in Chinese) · wms.mofcom.gov.cn
- 5. MOFCOM and 中国食品土畜进出口商会: China export monthly statistical report, tea, December 2021 (in Chinese) · wms.mofcom.gov.cn
- 6. MOFCOM and 中国食品土畜进出口商会: China export monthly statistical report, tea, December 2020 (in Chinese) · wms.mofcom.gov.cn
- 7. MOFCOM Department of Foreign Trade: China export monthly statistical report, tea, December 2019 (in Chinese) · wms.mofcom.gov.cn
- 8. MOFCOM Department of Foreign Trade: China export monthly statistical report, tea, December 2018 (in Chinese) · wms.mofcom.gov.cn
- 9. MOFCOM Department of Foreign Trade: China export monthly statistical report, tea, December 2017 (in Chinese) · wms.mofcom.gov.cn
- 10. MOFCOM Department of Foreign Trade: China export monthly statistical report, tea, December 2016 (in Chinese) · wms.mofcom.gov.cn
- 11. MOFCOM Department of Foreign Trade: China export monthly statistical report, tea, December 2015 (in Chinese) · wms.mofcom.gov.cn
- 12. MOFCOM and 中国食品土畜进出口商会: China export monthly statistical report, tea, April 2026 (in Chinese) · wms.mofcom.gov.cn
- 13. MOFCOM Department of Foreign Trade: archive of the monthly tea export reports, 2006 to April 2026, page dated 10 September 2026 (in Chinese) · wms.mofcom.gov.cn
- 14. State Council: Regulations of the People's Republic of China on Customs Statistics (海关统计条例), 2005, revised 29 March 2022, in the national database of administrative regulations (in Chinese) · xzfg.moj.gov.cn
- 15. National Bureau of Statistics of China: China Statistical Yearbook 2024, chapter 11, brief introduction · stats.gov.cn
- 16. General Administration of Customs of China: China Customs data processing system, presentation to the UN Statistics Division regional workshop on international merchandise trade statistics, Suzhou, 11 September 2017 · unstats.un.org
- 17. Zhejiang Agricultural Foreign Cooperation Centre, on MOFCOM's agricultural trade site: why Zhejiang tea sells around the world (农业贸易百问— 浙江茶叶缘何飘香世界?), 18 August 2020 (in Chinese) · cacs.mofcom.gov.cn
- 18. Zhejiang Economic Information Centre, from the Zhejiang Daily: tea across Zhejiang (茶香余韵满浙江), 29 May 2026 (in Chinese) · zjic.zj.gov.cn
- 19. Fujian Department of Commerce: action plan to expand Fujian's tea exports, 2022–2024 (闽商务〔2022〕12号), 2 March 2022 (in Chinese) · swt.fujian.gov.cn
- 20. Fujian Provincial Government, from the Fujian Daily: Fujian's tea exports third in China in January–September 2025, citing Xiamen Customs, 15 October 2025 (in Chinese) · fujian.gov.cn
- 21. Hunan Provincial Government, from the Hunan Daily: Hunan's black tea exports and tea industry, 6 June 2025 (in Chinese) · hunan.gov.cn
- 22. Ministry of Agriculture and Rural Affairs, from Rednet: Hunan's farm exports in 2024, citing Changsha Customs, 22 January 2025 (in Chinese) · moa.gov.cn
- 23. Hubei Department of Commerce, from the Hubei Daily: how Hubei tea can go abroad, 26 October 2021 (in Chinese) · swt.hubei.gov.cn
- 24. Hubei Department of Agriculture and Rural Affairs, from the Hubei Daily: Hubei tea in 47 countries and regions, 12 February 2018 (in Chinese) · nyt.hubei.gov.cn
- 25. China Association for the Promotion of International Agricultural Cooperation (CAPIAC), tea branch: China's tea export partners in 2024, 27 March 2025 (in Chinese) · capiac.org.cn