China tea production in 2025: output by type and province
China tea production in 2025: 3.64 million t of dry tea by CTMA's count, 3.92 million t by NBS. Output by type and province, and why the figures differ.
Key facts
- The China Tea Marketing Association (CTMA) counted 3.64 million tonnes of dry crude tea (干毛茶) produced in China in 2025, 4.0% more than in 2024, from 53.12 million mu (3.54 million hectares) of tea gardens, according to its annual report of April 2026.
- China's National Bureau of Statistics (NBS) put the country's tea output at 3.92 million tonnes in 2025, up 4.8%, in its preliminary statistical communiqué of 28 February 2026: about 280,000 tonnes more than CTMA's count.
- Green tea made up 59.03% of China's dry crude tea output in 2025, 2.15 million tonnes, followed by black tea (15.65%), dark tea (12.26%), oolong (9.61%), white tea (2.75%) and yellow tea (0.70%), according to CTMA.
- In CTMA's 2024 survey Fujian produced the most tea, 500,064 tonnes, and Yunnan had the largest tea garden area, 7.78 million mu; for 2025 the statistics bureaus of Yunnan and Fujian reported 611,500 and 601,900 tonnes.
- China's tea output as first published in NBS statistical communiqués rose 75% in ten years, from 2.24 million tonnes in 2015 to 3.92 million tonnes in 2025 (The Tea Trade's calculation).
China produced 3.64 million tonnes of tea in 2025 according to the China Tea Marketing Association (CTMA, 中国茶叶流通协会), and 3.92 million tonnes according to China’s National Bureau of Statistics (NBS, 国家统计局). Both weigh tea as dry crude tea (干毛茶), the product of initial processing, but CTMA’s figure comes from its survey of the producing provinces and NBS’s from farm statistics totalled from village level upwards; the gap, about 280,000 tonnes in 2025, has grown since 2023. By CTMA’s count, green tea made up 59.03% of output, and Fujian, Yunnan, Sichuan, Guizhou and Hubei each produced more than 370,000 tonnes in 2024.
China’s tea output in 2025: two national figures
CTMA is a national trade association founded in 1992, registered with the Ministry of Civil Affairs and supervised by the All-China Federation of Supply and Marketing Cooperatives. Its yearly tea production and sales report (茶叶产销形势分析报告) rests on its own survey. The report on 2025, released in April 2026, put output at 364.03万吨 (3,640,300 tonnes), grown on 5,312.26万亩 of tea gardens, about 3.54 million hectares at 15 mu to the hectare (The Tea Trade’s conversion).
NBS gives tea one sentence in its statistical communiqué (统计公报), published each February next to cotton, oilseeds and sugar crops. For 2025 it reads “茶叶产量392万吨,增产4.8%”: tea output of 3.92 million tonnes, up 4.8%. The communiqué states that all its figures are preliminary (初步统计数), and it gives no tea garden area or value.
China’s tea output in 2025 and 2024: CTMA and NBS (sources: CTMA annual reports; NBS statistical communiqués)
| Indicator | CTMA | NBS |
|---|---|---|
| Output, 2025 | 3,640,300 t | 3.92 million t (preliminary) |
| Change on 2024 | +4.0% (calculated) | +4.8% |
| Output, 2024 | 3,499,138 t | 3.74 million t |
| Tea garden area | 5,312.26万亩 (3.54 million ha) in 2025 | not in the communiqué |
| Gardens being picked | 4,756.90万亩 (3.17 million ha) in 2024 | not in the communiqué |
| Value of dry crude tea | 333.2 billion yuan in 2025, +3.5% (calculated) | not in the communiqué |
| Released | 9 April 2026 (report, part 1) | 28 February 2026 |
NBS’s figure was about 280,000 tonnes, or 7.7%, above CTMA’s in 2025 (The Tea Trade’s calculation: 392 − 364.03 = 27.97万吨).
Why the CTMA and NBS tea output figures differ
Both bodies count the same product. NBS’s reporting rules, as printed by Zhejiang’s statistics bureau for 2024 and 2025, define tea output as all the tea produced in the year, weighed as dry crude tea after initial processing, and CTMA reports dry crude tea too. The differences lie in who is counted, how and when.
How CTMA and NBS count China’s tea output (sources: NBS farm statistics reporting system; CTMA survey page and reports)
| CTMA | NBS | |
|---|---|---|
| What is weighed | dry crude tea (干毛茶) | dry crude tea (干毛茶) |
| Who is covered | the main producing provinces, 19 in its 2024 tables | all farm households and units, including tea picked from scattered bushes and from abandoned bushes not yet restored, whether sold or kept |
| How it is collected | yearly production and sales survey of the producing provinces; the round covering 2025 closed on 31 January 2026 | farm reports totalled from village to township, county and province |
| Tea types | six types | six types and “other tea” on the forms; green tea output, but not its area, is published (NBS reply, 2024) |
| First release | April of the following year (report date) | February of the following year, preliminary |
Revisions add another difference. The growth rates in NBS’s communiqués do not always match the totals first published, which implies that earlier years were revised. Its 2017 communiqué gave 2.55 million tonnes, but its 2018 communiqué reported 2.61 million tonnes, up 5.9%, which implies about 2.46 million tonnes for 2017; that communiqué notes that past farm, livestock and fishery data were revised in line with the third national agricultural census (第三次全国农业普查). Likewise, the 2.97 million tonnes first published for 2020 and the 8.3% growth reported for 2021 imply about 2.94 million, a change the 2021 communiqué does not explain. Both implied figures are The Tea Trade’s calculations (261 ÷ 1.059 and 318 ÷ 1.083), not NBS data: NBS’s revised series, in its China Statistical Yearbook (中国统计年鉴), was not read for this guide.
The two series have also drifted apart. For 2020 CTMA counted 2.986 million tonnes, slightly more than the 2.97 million NBS first published; by 2023 NBS’s figure was 6.3% above CTMA’s, and the margin grew to 6.9% in 2024 and 7.7% in 2025 (The Tea Trade’s calculation). The gaps also vary by province (see below). In the publications reviewed, neither body comments on the other’s figure or says how much of the gap each difference explains.
Tea garden area has a third count. The third national land survey (第三次全国国土调查), built on satellite images with a resolution better than 1 metre and a reference date of 31 December 2019, mapped 1.68 million hectares (2,527.05万亩) of tea gardens, less than half the 3.54 million hectares CTMA counted six years later, for 2025. NBS’s own rules count gardens planted as blocks, including neglected gardens that a little work would bring back into production, and do not convert scattered bushes into area.
Tea output by type: green, black, dark, oolong, white and yellow
China’s tea is mostly green, and CTMA’s breakdown has changed little in three years. Green tea grew 4.3% in 2025, to 2.15 million tonnes, while black tea grew fastest (+11.6%) and dark tea and yellow tea fell (The Tea Trade’s calculation from CTMA’s tables). Named premium teas (名优茶) and bulk teas (大宗茶) stood at about 4 to 6 by volume, CTMA adds.
China’s dry crude tea output by type, 2023–2025 (source: CTMA reports for 2024 and 2025)
| Type | 2023 (t) | 2024 (t) | 2025 (t) | Share of output, 2025 | Share of value, 2025 |
|---|---|---|---|---|---|
| Green (绿茶) | 1,934,000 | 2,060,300 | 2,148,700 | 59.03% | 62.67% |
| Black (红茶) | 491,200 | 510,300 | 569,700 | 15.65% | 17.81% |
| Dark (黑茶) | 458,000 | 473,200 | 446,500 | 12.26% | 8.75% |
| Oolong (乌龙茶) | 332,800 | 332,400 | 349,800 | 9.61% | 8.11% |
| White (白茶) | 100,200 | 93,800 | 100,100 | 2.75% | 2.03% |
| Yellow (黄茶) | 23,300 | 29,100 | 25,500 | 0.70% | 0.63% |
| Total | 3,339,500 | 3,499,100 | 3,640,300 | 100% | 100% |
CTMA gives the types in 万吨 to two decimals, so tonnages are rounded to the nearest 100 tonnes. By value, the 333.2 billion yuan of 2025 split into 208.8 billion for green tea, 59.3 billion for black, 29.2 billion for dark, 27.0 billion for oolong, 6.8 billion for white and 2.1 billion for yellow tea.
NBS treats types differently. Its reporting forms list green tea, oolong (青茶), black, dark, yellow, white and “other tea”, and file Hunan dark tea, Hubei laoqing, Guangxi Liupao, Yunnan pu-erh (普洱茶) and Sichuan border tea under dark tea (黑茶). Asked for green tea data in January 2024, its rural survey department replied that NBS compiles green tea output but not the area planted to green tea: 1.976 million tonnes in 2020, 2.174 million in 2021 and 2.268 million in 2022, published in the China Rural Statistical Yearbook (中国农村统计年鉴). NBS’s green tea figure for 2022 is larger than CTMA’s green tea output for 2024. How the six types map onto customs categories is explained in our guide to Chinese tea types.
Tea production by province
In CTMA’s 2024 tables, Fujian produced the most tea, Yunnan had the largest tea garden area and Guizhou the largest output value. Its 2025 report puts the same three provinces first again, in charts without figures, and names Yunnan, Guizhou, Sichuan and Hubei as the four largest by garden area.
Tea gardens, output and value by province, 2024 (source: CTMA, 2024 report)
| Province | Tea garden area (万亩) | Output (t) | Share of output | Value of dry crude tea (billion yuan) |
|---|---|---|---|---|
| Fujian | 378.00 | 500,064 | 14.3% | 27.9 |
| Yunnan | 778.00 | 463,700 | 13.3% | 32.6 |
| Sichuan | 601.00 | 397,550 | 11.4% | 40.3 |
| Guizhou | 698.60 | 377,900 | 10.8% | 46.7 |
| Hubei | 572.00 | 371,756 | 10.6% | 21.2 |
| Hunan | 336.42 | 285,500 | 8.2% | 20.1 |
| Zhejiang | 325.60 | 206,500 | 5.9% | 30.2 |
| Anhui | 323.29 | 180,700 | 5.2% | 23.9 |
| Guangdong | 159.05 | 160,160 | 4.6% | 14.7 |
| Shaanxi | 246.87 | 127,452 | 3.6% | 19.5 |
| Guangxi | 166.80 | 125,477 | 3.6% | 11.4 |
| Henan | 231.00 | 110,033 | 3.1% | 9.6 |
| Seven others | 426.20 | 192,346 | 5.5% | 23.6 |
| Total | 5,242.83 | 3,499,138 | 100% | 321.8 |
The seven others are Jiangxi, Chongqing, Shandong, Jiangsu, Gansu, Hainan and Tibet, whose 5.16万亩 and 217 tonnes appear in CTMA’s tables for the first time in 2024. Shares and values in billion yuan are The Tea Trade’s calculation from CTMA’s tables. In 2024, CTMA recorded output gains of close to 25,000 tonnes each in Yunnan and Hubei, while Henan, Zhejiang, Guangxi and Fujian each added at least 100,000 mu of gardens.
The provincial statistics bureaus, whose figures come from the NBS reporting system, publish higher output figures for the provinces checked.
Four provinces, two counts (tonnes; sources: CTMA; provincial statistics bureaus)
| Province | CTMA, 2024 | Statistics bureau, 2024 | Statistics bureau, 2025 |
|---|---|---|---|
| Fujian | 500,064 | 577,800 | 601,900 |
| Yunnan | 463,700 | 586,200 | 611,500 |
| Hubei | 371,756 | 474,100 | 497,800 |
| Hunan | 285,500 | 287,000 | 302,000 |
For 2024, Hunan’s two counts differ by only 0.5%, while the statistics bureaus’ figures are 15.5% above CTMA’s for Fujian, 26.4% for Yunnan and 27.5% for Hubei (The Tea Trade’s calculation). Yunnan’s statistics bureau also gives an area: 543,400 hectares of tea gardens in 2025, about 8.15 million mu, against 7.78 million mu in CTMA’s 2024 table. A province’s output is not its exports: export statistics place tea in the province where the exporter is registered or where the goods were produced or first dispatched, as our guide to China’s tea exports by province explains.
China tea production from 2015 to 2025
As first published in NBS’s communiqués, China’s tea output rose every year, from 2.24 million tonnes in 2015 to 3.92 million tonnes in 2025, 75% more, with annual growth of 4.8% to 8.3%. CTMA’s own reports read for this guide give its figures for 2020 and for 2023 to 2025.
China’s tea output, 2015–2025 (million tonnes; sources: NBS statistical communiqués; CTMA reports)
| Year | NBS, as first published | NBS growth, as published | CTMA |
|---|---|---|---|
| 2015 | 2.24 | +6.9% | — |
| 2016 | 2.41 | +7.4% | — |
| 2017 | 2.55 | +6.0% | — |
| 2018 | 2.61 | +5.9% | — |
| 2019 | 2.80 | +7.2% | — |
| 2020 | 2.97 | +7.1% | 2.99 |
| 2021 | 3.18 | +8.3% | — |
| 2022 | 3.35 | +5.7% | — |
| 2023 | 3.55 | +6.1% | 3.34 |
| 2024 | 3.74 | +5.5% | 3.50 |
| 2025 | 3.92 (preliminary) | +4.8% | 3.64 |
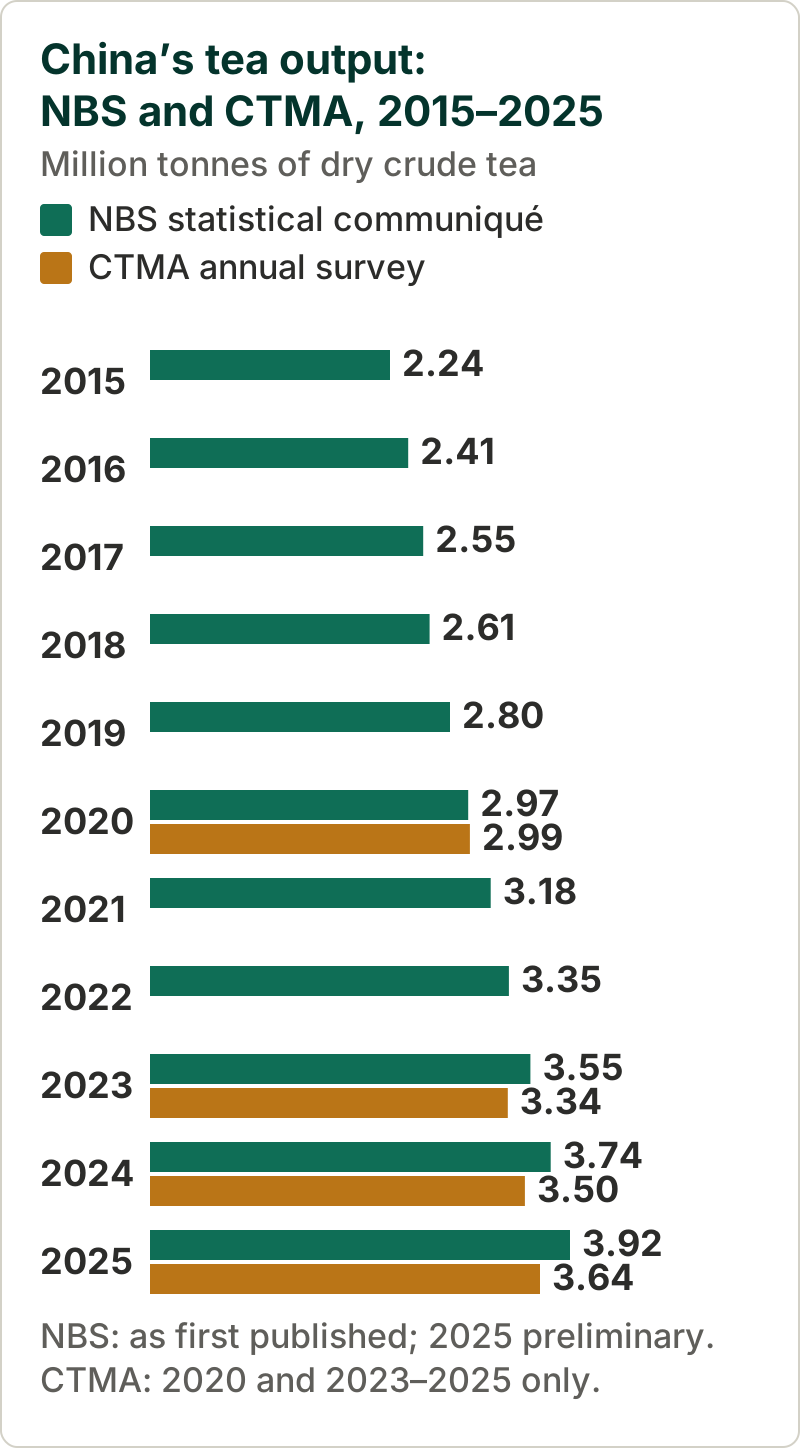 Source: NBS statistical communiqués, 2015–2025, figures as first published; CTMA reports (2020, 2023–2025)
Over the years both sources cover, NBS’s count grew faster: from 2020 to 2025, its figure rose 32.0% and CTMA’s 21.9% (The Tea Trade’s calculation: 392 ÷ 297 and 364.03 ÷ 298.6). China’s tea exports over the same decade are traced in our guide to Chinese tea export markets.
Varieties, residues and export gardens in 2025
CTMA’s 2025 report also describes how the gardens are run. Clonal improved varieties covered 68.5% of the tea garden area, and green pest and disease control 64.5%. China had set 110 pesticide residue limits for tea products, 74 for tea and 36 for tea drinks; tea passed the 2025 national routine monitoring of farm product quality at a rate of 99.4%; and organic tea came to about 8% of output. Customs in several provinces also tried new ways of supervising export gardens in 2025, the report adds: Fujian piloted a “large base” model that brought 265,000 mu of tea gardens under unified management, and Xiangxi prefecture in Hunan registered 350,000 mu of gardens in a single filing. Limits for the EU market are compared in our guide to EU pesticide limits for tea.
What the production figures mean for buyers
- Quote a source and a year. 3.64 million tonnes (CTMA) and 3.92 million tonnes (NBS) are both published answers for 2025. Do not mix the two series in one calculation, and do not average them.
- Most Chinese tea stays in China. China exported 418,757 tonnes of tea in 2025, according to MOFCOM: about 11.5% of CTMA’s output figure or 10.7% of NBS’s (The Tea Trade’s calculation, which compares exported tea with crude tea). Exports by type, country and price are in our guide to China’s tea exports in 2025.
- Green tea is the bulk of supply. It was 59% of output in 2025 by CTMA’s count but 88.1% of export volume, according to MOFCOM, so most of China’s black, dark, oolong and white tea stays in China.
- Ask where the tea was grown. A province’s output, its garden area and its exports are three different maps.
- Expect revisions. NBS’s communiqué figures are preliminary and can be revised. NBS published them on 28 February in 2025 and 2026; CTMA’s last two reports are dated April (checked October 2026).
Questions and answers
How much tea does China produce?
In 2025, 3.64 million tonnes of dry crude tea according to the China Tea Marketing Association (CTMA), or 3.92 million tonnes according to the National Bureau of Statistics (NBS), whose figure is preliminary. Both weigh tea as dry crude tea, the product of initial processing.
Why are there two figures for China's tea output?
They are collected differently. NBS's farm statistics cover every farm household and unit and count tea from scattered and abandoned bushes as well as tea gardens; CTMA surveys the producing provinces. NBS's figure was 7.7% above CTMA's in 2025, and the publications reviewed give no reconciliation.
Which province produces the most tea in China?
Fujian in CTMA's 2024 survey, with 500,064 tonnes, ahead of Yunnan (463,700 tonnes). For 2025 the provincial statistics bureaus put Yunnan (611,500 tonnes) slightly ahead of Fujian (601,900 tonnes). Yunnan has the largest tea garden area in CTMA's count.
How much of China's tea is green tea?
59.03% of the 2025 output by CTMA's count, or 2.15 million tonnes, and 62.67% of its value. NBS publishes green tea separately, in the China Rural Statistical Yearbook: 2.268 million tonnes in 2022, the latest year it gave in a reply of January 2024.
How large are China's tea gardens?
53.12 million mu, about 3.54 million hectares, in 2025 by CTMA's count. The third national land survey mapped 1.68 million hectares of tea gardens at its reference date of 31 December 2019, so area figures differ even more than output figures.
How much of China's tea production is exported?
About a tenth. China exported 418,757 tonnes of tea in 2025, according to MOFCOM: 11.5% of CTMA's output figure or 10.7% of NBS's (The Tea Trade's calculation, which compares exported tea with crude tea, so the ratio is approximate).
Sources
- 1. National Bureau of Statistics: statistical communiqué on the 2025 national economic and social development, 28 February 2026 (State Council portal copy, in Chinese) · gov.cn
- 2. National Bureau of Statistics: statistical communiqué on the 2024 national economic and social development, 28 February 2025 (State Council portal copy, in Chinese) · gov.cn
- 3. National Bureau of Statistics: statistical communiqué on the 2023 national economic and social development, 29 February 2024 (State Council portal copy, in Chinese) · gov.cn
- 4. National Bureau of Statistics: statistical communiqué on the 2022 national economic and social development, 28 February 2023 (State Council portal copy, in Chinese) · gov.cn
- 5. National Bureau of Statistics: statistical communiqué on the 2021 national economic and social development, 28 February 2022 (in Chinese) · stats.gov.cn
- 6. National Bureau of Statistics: statistical communiqué on the 2020 national economic and social development (in Chinese) · stats.gov.cn
- 7. National Bureau of Statistics: statistical communiqué on the 2019 national economic and social development (in Chinese) · stats.gov.cn
- 8. National Bureau of Statistics: statistical communiqué on the 2018 national economic and social development (in Chinese) · stats.gov.cn
- 9. National Bureau of Statistics: statistical communiqué on the 2017 national economic and social development (in Chinese) · stats.gov.cn
- 10. National Bureau of Statistics: statistical communiqué on the 2016 national economic and social development (in Chinese) · stats.gov.cn
- 11. National Bureau of Statistics: statistical communiqué on the 2015 national economic and social development, 29 February 2016 (State Council portal copy, in Chinese) · app.www.gov.cn
- 12. National Bureau of Statistics, rural survey department: reply on green tea output statistics, 12 January 2024 (in Chinese) · stats.gov.cn
- 13. National Bureau of Statistics, Zhejiang Provincial Bureau of Statistics and Zhejiang Department of Agriculture and Rural Affairs: Zhejiang agricultural production statistical reporting system for 2024 and 2025, December 2024 (in Chinese) · zjjcmspublic.oss-cn-hangzhou-zwynet-d01-a.internet.cloud.zj.gov.cn
- 14. State Council Third National Land Survey Office, Ministry of Natural Resources and National Bureau of Statistics: main data of the third national land survey, 25 August 2021 (Hubei Department of Natural Resources copy, in Chinese) · zrzyt.hubei.gov.cn
- 15. Fujian Provincial Bureau of Statistics: statistical communiqué on Fujian's economic and social development in 2025 (in Chinese) · tjj.fujian.gov.cn
- 16. Fujian Provincial Bureau of Statistics: statistical communiqué on Fujian's economic and social development in 2024 (in Chinese) · tjj.fujian.gov.cn
- 17. Yunnan Provincial Bureau of Statistics: statistical communiqué on Yunnan's economic and social development in 2025 (Yunnan People's Congress website copy, in Chinese) · ynrd.gov.cn
- 18. Yunnan Provincial Bureau of Statistics: statistical communiqué on Yunnan's economic and social development in 2024 (Yunnan People's Congress website copy, in Chinese) · ynrd.gov.cn
- 19. Hubei Provincial Bureau of Statistics: statistical communiqué on Hubei's economic and social development in 2025 (in Chinese) · tjj.hubei.gov.cn
- 20. Hubei Provincial Bureau of Statistics: statistical communiqué on Hubei's economic and social development in 2024 (in Chinese) · tjj.hubei.gov.cn
- 21. Hunan Provincial Bureau of Statistics: statistical communiqué on Hunan's economic and social development in 2025 (Hunan provincial government portal, in Chinese) · hunan.gov.cn
- 22. Hunan Provincial Bureau of Statistics: statistical communiqué on Hunan's economic and social development in 2024 (in Chinese) · tjj.hunan.gov.cn
- 23. MOFCOM and 中国食品土畜进出口商会: China export monthly statistical report, tea, December 2025 (in Chinese) · wms.mofcom.gov.cn
- 24. China Tea Marketing Association: 2025 tea production and sales analysis, part 1, 9 April 2026 (association's news-portal account, in Chinese) · sohu.com
- 25. China Tea Marketing Association: 2024 tea production and sales analysis report, April 2025 (in Chinese) · ctma.com.cn
- 26. China Tea Marketing Association: 2021 China tea consumption market report, 19 January 2022 (in Chinese) · ctma.com.cn
- 27. China Tea Marketing Association: surveys, including the 2025 national tea production and sales survey of producing provinces (in Chinese) · ctma.com.cn
- 28. China Tea Marketing Association: about the association (in Chinese) · ctma.com.cn