Chinese tea export markets: top 20 destinations, 2015–2025
Chinese tea export markets, 2015–2025: Morocco took 91,393 t in 2025 and Africa 65.1% of the volume. The top 20 by volume and value, with 10-year changes.
Key facts
- Morocco was the first destination for Chinese tea in 2025, receiving 91,393 tonnes worth US$278.1 million, 21.8% of China's tea export volume, according to MOFCOM (share: The Tea Trade's calculation).
- China's tea exports rose from 324,956 tonnes in 2015 to 418,757 tonnes in 2025, an increase of 28.9%, or 2.6% a year, according to The Tea Trade's calculation from MOFCOM's December reports.
- Africa received 65.1% of China's tea export volume in 2025, up from 53.2% in 2015, according to MOFCOM's figures by continent (shares: The Tea Trade's calculation).
- Between 2015 and 2025, Côte d'Ivoire, Chad, Niger and Poland entered the top 20 destinations for Chinese tea by volume, while Togo, Hong Kong, Pakistan and France left it, according to The Tea Trade's ranking of UN Comtrade data.
- Hong Kong was the first destination for Chinese tea by value every year from 2017 to 2023 and took US$647.9 million in 2021, according to MOFCOM, but only US$33.7 million in 2025, according to UN Comtrade.
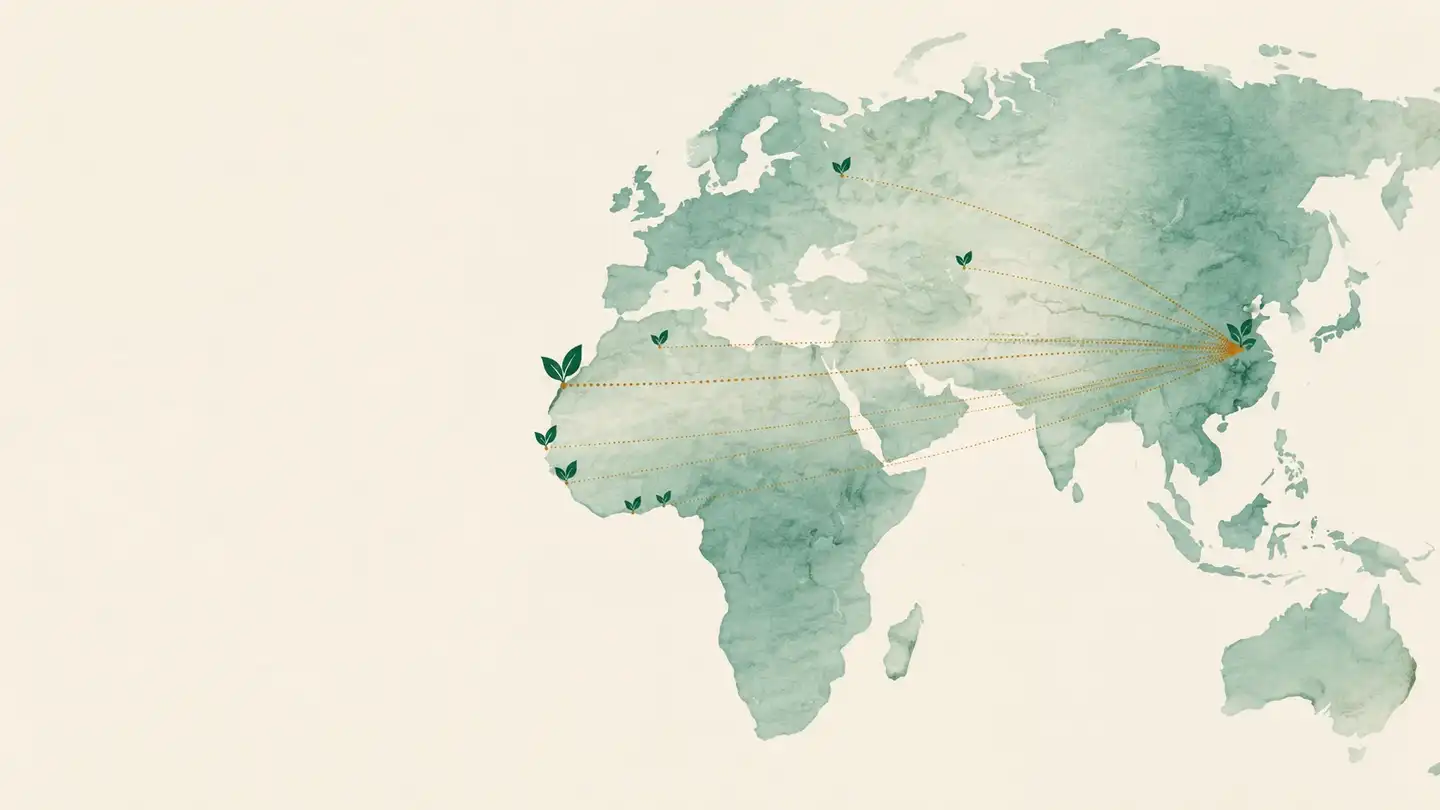
Morocco is the first market for Chinese tea: in 2025 it received 91,393 tonnes, 21.8% of the 418,757 tonnes China exported, ahead of Uzbekistan, Senegal, Mauritania and Ghana, according to China’s Ministry of Commerce (MOFCOM) and UN Comtrade. Over ten years, China’s tea export markets have tilted towards Africa, which took 65.1% of the volume in 2025 against 53.2% in 2015, while total exports grew 28.9%, or 2.6% a year (our calculation). Côte d’Ivoire, Chad, Niger and Poland entered the top 20 destinations; Togo, Hong Kong, Pakistan and France left it.
Top 20 destinations for Chinese tea in 2025
In 2025 the 20 largest destinations took 82.7% of China’s tea export volume and 75.2% of its value.
Top 20 destinations for Chinese tea by volume, 2025 (tonnes, US$ million, US$/kg; sources: MOFCOM, UN Comtrade via WITS)
| Rank | Country | Volume (t) | Share of volume | Value (US$ million) | Share of value | Unit value (US$/kg) |
|---|---|---|---|---|---|---|
| 1 | Morocco | 91,393 | 21.8% | 278.1 | 18.0% | 3.04 |
| 2 | Uzbekistan | 29,217 | 7.0% | 61.5 | 4.0% | 2.11 |
| 3 | Senegal | 24,449 | 5.8% | 98.4 | 6.4% | 4.02 |
| 4 | Mauritania | 20,117 | 4.8% | 83.2 | 5.4% | 4.14 |
| 5 | Ghana | 18,075 | 4.3% | 72.4 | 4.7% | 4.00 |
| 6 | Côte d’Ivoire | 16,701 | 4.0% | 71.1 | 4.6% | 4.26 |
| 7 | Russia | 16,038 | 3.8% | 48.6 | 3.1% | 3.03 |
| 8 | Algeria | 15,298 | 3.7% | 53.9 | 3.5% | 3.52 |
| 9 | Chad | 12,894 | 3.1% | 15.0 | 1.0% | 1.16 |
| 10 | Japan | 11,192 | 2.7% | 64.1 | 4.1% | 5.73 |
| 11 | Niger | 11,082 | 2.6% | 31.3 | 2.0% | 2.83 |
| 12 | United States | 10,456 | 2.5% | 66.4 | 4.3% | 6.35 |
| 13 | Mali | 10,326 | 2.5% | 41.3 | 2.7% | 4.00 |
| 14 | Libya | 9,862 | 2.4% | 29.3 | 1.9% | 2.97 |
| 15 | Germany | 9,503 | 2.3% | 44.3 | 2.9% | 4.66 |
| 16 | Gambia | 8,638 | 2.1% | 31.0 | 2.0% | 3.59 |
| 17 | Cameroon | 8,228 | 2.0% | 7.5 | 0.5% | 0.91 |
| 18 | Benin | 7,988 | 1.9% | 20.8 | 1.3% | 2.61 |
| 19 | Poland | 7,972 | 1.9% | 20.5 | 1.3% | 2.57 |
| 20 | Thailand | 6,702 | 1.6% | 23.4 | 1.5% | 3.49 |
Sources: MOFCOM for the nine of these countries in its top 10 by value; UN Comtrade via WITS for the other eleven and the ranking. Shares and unit values (FOB value ÷ volume): our calculation.
Ranked by value, the order changes. Senegal comes second (US$98.4 million) and Malaysia third, with US$84.9 million for 4,008 tonnes. Malaysia, Hong Kong (14th), Vietnam (17th) and France (20th) enter the value top 20 in place of Chad, Cameroon, Benin and Poland. For 2025 by tea type, pack size and exporting province, see our guide to China’s 2025 tea exports.
China’s tea exports by year, 2015–2025
China’s tea exports by year, 2015–2025 (tonnes, US$ million, US$/kg; source: MOFCOM December reports)
| Year | Volume (t) | Value (US$ million) | Average unit value (US$/kg) | To Morocco (t) | Africa’s share of volume |
|---|---|---|---|---|---|
| 2015 | 324,956 | 1,381.6 | 4.25 | 64,438 | 53.2% |
| 2016 | 328,694 | 1,484.9 | 4.52 | 67,285 | 53.7% |
| 2017 | 355,252 | 1,609.6 | 4.53 | 75,278 | 54.6% |
| 2018 | 364,742 | 1,777.9 | 4.87 | 77,563 | 55.0% |
| 2019 | 366,528 | 2,019.5 | 5.51 | 74,284 | 55.0% |
| 2020 | 348,814 | 2,038.1 | 5.84 | 67,159 | 56.7% |
| 2021 | 369,355 | 2,299.2 | 6.22 | 74,610 | 56.2% |
| 2022 | 375,255 | 2,082.7 | 5.55 | 75,440 | 56.1% |
| 2023 | 367,542 | 1,739.2 | 4.73 | 59,832 | 60.3% |
| 2024 | 374,118 | 1,419.3 | 3.79 | 80,584 | 63.5% |
| 2025 | 418,757 | 1,545.7 | 3.69 | 91,393 | 65.1% |
For 2020 to 2024, MOFCOM’s overviews round the totals, so the table uses the sum of its rows by continent. Africa’s share and the average unit value (FOB value ÷ volume) are our calculation.
Volume rose in eight of the ten years, falling only in 2020 (−4.8%) and 2023 (−2.1%). Over the decade it grew 28.9%, a compound annual growth rate (CAGR) of 2.6%: (418,757 ÷ 324,956)^(1/10) − 1. Value took another path. It climbed to US$2,299.2 million in 2021, then fell three years running, so the 2025 total was only 11.9% above 2015. The average unit value peaked at US$6.22/kg in 2021 and was 40.7% lower in 2025.
By continent, Africa’s volume rose 57.8%, from 172,887 to 272,790 tonnes. Asia’s fell 5.7% and its share from 27.1% to 19.8%; Europe’s share slipped from 13.1% to 11.8% and North America’s from 5.4% to 2.8% (MOFCOM; shares our calculation).
Top importers of Chinese tea: 2015, 2020 and 2025 compared
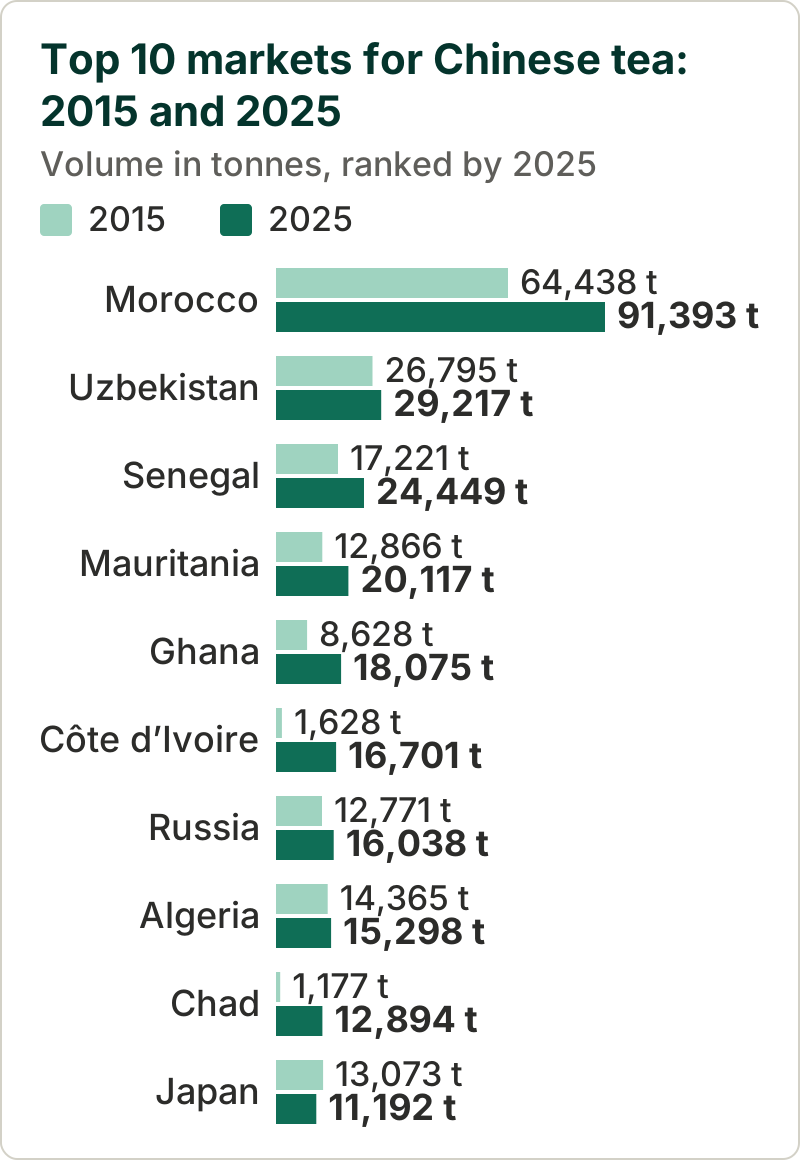
The tables below follow the 20 largest destinations of 2025 back to 2015 and 2020 in China’s UN Comtrade figures. Change = 2025 ÷ 2015 − 1; CAGR = (2025 ÷ 2015)^(1/10) − 1.
 Sources: UN Comtrade via WITS (2015, 2025); MOFCOM (2025)
Volume of the 2025 top 20 in 2015, 2020 and 2025 (tonnes and rank by volume; source: UN Comtrade via WITS)
| Country | 2015 (t) | 2020 (t) | 2025 (t) | Rank 2015 → 2025 | Change 2015–2025 | CAGR |
|---|---|---|---|---|---|---|
| Morocco | 64,438 | 67,159 | 91,393 | 1 → 1 | +41.8% | +3.6% |
| Uzbekistan | 26,795 | 23,032 | 29,217 | 2 → 2 | +9.0% | +0.9% |
| Senegal | 17,221 | 16,902 | 24,449 | 3 → 3 | +42.0% | +3.6% |
| Mauritania | 12,866 | 14,098 | 20,117 | 8 → 4 | +56.4% | +4.6% |
| Ghana | 8,628 | 18,730 | 18,075 | 12 → 5 | +109.5% | +7.7% |
| Côte d’Ivoire | 1,628 | 2,197 | 16,701 | 37 → 6 | +925.8% | +26.2% |
| Russia | 12,771 | 14,812 | 16,038 | 9 → 7 | +25.6% | +2.3% |
| Algeria | 14,365 | 13,894 | 15,298 | 5 → 8 | +6.5% | +0.6% |
| Chad | 1,177 | 731 | 12,894 | 42 → 9 | +995.5% | +27.0% |
| Japan | 13,073 | 11,487 | 11,192 | 7 → 10 | −14.4% | −1.5% |
| Niger | 2,704 | 4,730 | 11,082 | 24 → 11 | +309.9% | +15.1% |
| United States | 16,356 | 9,661 | 10,456 | 4 → 12 | −36.1% | −4.4% |
| Mali | 5,888 | 3,230 | 10,326 | 15 → 13 | +75.4% | +5.8% |
| Libya | 5,007 | 3,126 | 9,862 | 17 → 14 | +97.0% | +7.0% |
| Germany | 12,466 | 8,350 | 9,503 | 10 → 15 | −23.8% | −2.7% |
| Gambia | 4,627 | 5,535 | 8,638 | 18 → 16 | +86.7% | +6.4% |
| Cameroon | 7,488 | 13,574 | 8,228 | 13 → 17 | +9.9% | +0.9% |
| Benin | 4,564 | 5,878 | 7,988 | 19 → 18 | +75.0% | +5.8% |
| Poland | 2,101 | 6,090 | 7,972 | 31 → 19 | +279.4% | +14.3% |
| Thailand | 4,115 | 4,546 | 6,702 | 20 → 20 | +62.9% | +5.0% |
Thirteen of these markets grew faster than China’s total (+28.9%), and three shrank: the United States (−36.1%), Germany (−23.8%) and Japan (−14.4%). Uzbekistan (+9.0%), Cameroon (+9.9%) and Algeria (+6.5%) grew by less than 10%. Few paths were smooth: Ghana took 18,730 tonnes in 2020 and 38,623 tonnes in 2024 (MOFCOM) before falling 53.2% in 2025, and Cameroon took 13,574 tonnes in 2020 against 8,228 in 2025.
Value of the 2025 top 20 in 2015, 2020 and 2025 (US$ million and rank by value; source: UN Comtrade via WITS)
| Country | 2015 | 2020 | 2025 | Change 2015–2025 | Rank 2015 → 2025 |
|---|---|---|---|---|---|
| Morocco | 226.7 | 198.2 | 278.1 | +22.7% | 1 → 1 |
| Uzbekistan | 50.4 | 40.4 | 61.5 | +22.1% | 10 → 9 |
| Senegal | 75.4 | 67.4 | 98.4 | +30.5% | 4 → 2 |
| Mauritania | 55.7 | 60.2 | 83.2 | +49.5% | 8 → 4 |
| Ghana | 38.7 | 79.8 | 72.4 | +87.2% | 12 → 5 |
| Côte d’Ivoire | 5.5 | 9.4 | 71.1 | +1,190.0% | 38 → 6 |
| Russia | 37.2 | 38.7 | 48.6 | +30.6% | 13 → 11 |
| Algeria | 52.2 | 47.1 | 53.9 | +3.1% | 9 → 10 |
| Chad | 1.1 | 1.8 | 15.0 | +1,228.3% | 55 → 25 |
| Japan | 56.7 | 57.2 | 64.1 | +13.1% | 7 → 8 |
| Niger | 11.3 | 12.5 | 31.3 | +177.9% | 24 → 15 |
| United States | 91.2 | 52.8 | 66.4 | −27.2% | 3 → 7 |
| Mali | 27.8 | 13.8 | 41.3 | +48.5% | 16 → 13 |
| Libya | 14.4 | 11.0 | 29.3 | +103.8% | 22 → 18 |
| Germany | 49.6 | 32.9 | 44.3 | −10.7% | 11 → 12 |
| Gambia | 18.9 | 21.9 | 31.0 | +63.7% | 20 → 16 |
| Cameroon | 6.4 | 16.2 | 7.5 | +17.0% | 33 → 32 |
| Benin | 7.8 | 15.2 | 20.8 | +166.3% | 30 → 22 |
| Poland | 5.8 | 14.4 | 20.5 | +254.9% | 35 → 23 |
| Thailand | 18.8 | 33.1 | 23.4 | +24.5% | 21 → 19 |
New entrants and drop-outs since 2015
Countries that entered or left the top 20 by volume, 2015 → 2025 (rank and tonnes; source: UN Comtrade via WITS)
| Movement | Country | 2015 | 2020 | 2025 |
|---|---|---|---|---|
| Entered | Côte d’Ivoire | 37th (1,628 t) | 33rd (2,197 t) | 6th (16,701 t) |
| Entered | Chad | 42nd (1,177 t) | 48th (731 t) | 9th (12,894 t) |
| Entered | Niger | 24th (2,704 t) | 20th (4,730 t) | 11th (11,082 t) |
| Entered | Poland | 31st (2,101 t) | 14th (6,090 t) | 19th (7,972 t) |
| Left | Togo | 6th (13,312 t) | 4th (17,637 t) | 30th (2,582 t) |
| Left | Hong Kong | 11th (10,310 t) | 8th (13,974 t) | 26th (3,606 t) |
| Left | Pakistan | 14th (6,620 t) | 17th (5,603 t) | 36th (1,775 t) |
| Left | France | 16th (5,544 t) | 24th (3,675 t) | 22nd (4,803 t) |
Customs data show where tea was declared to go, not why buyers changed. China records each export under its country of final destination, the country of consumption, use or further processing known at export, or, failing that, the last country the goods are known to be shipped to (National Bureau of Statistics of China). The recorded country can therefore differ from the country where the tea is consumed. Our guide to Côte d’Ivoire’s tea imports compares China’s figures with Ivorian records.
Hong Kong dropped out by volume, yet it was the first destination by value every year from 2017 to 2023, according to MOFCOM. In 2021 it took US$647.9 million, 28.2% of China’s tea export value, for 16,729 tonnes: a unit value of US$38.7/kg (our calculation). In 2025 it took US$33.7 million. Vietnam fell from US$132.7 million in 2020 to US$29.6 million, Myanmar from US$114.5 million to US$2.2 million, and Malaysia from US$284.7 million in 2022 to US$84.9 million (MOFCOM; UN Comtrade).
Unit value of Chinese tea exports by destination
A unit value is the declared value divided by the quantity. It is computed from customs statistics and is not a price: it mixes grades and pack formats, and China records exports at their free-on-board (FOB) value (National Bureau of Statistics of China). In 2025, among the top 20, it ranged from US$0.91/kg for Cameroon and US$1.16/kg for Chad to US$5.73/kg for Japan and US$6.35/kg for the United States (our calculation). Morocco’s tea came to US$3.04/kg, against US$4.00 to 4.26/kg for Senegal, Mauritania, Ghana, Côte d’Ivoire and Mali.
The product mix differs too. In 2025, black and partly fermented tea (HS 0902.30 and 0902.40) made up 63.5% of the volume shipped to Japan, 42.9% to the United States, 41.2% to Poland, 36.3% to Thailand, 27.5% to Russia, 22.0% to Germany and 10.8% to Libya; for the other 13 markets, green tea was more than 99% (our calculation from UN Comtrade).
Between 2015 and 2025, unit values fell in ten of the 20 markets, including Morocco (US$3.52 to 3.04/kg), Senegal (US$4.38 to 4.02/kg) and Mali (US$4.72 to 4.00/kg), and rose in the other ten, such as Japan (US$4.33 to 5.73/kg) and the United States (US$5.58 to 6.35/kg). A few small, high-value destinations lift the national average: without Malaysia (US$21.18/kg in 2025), Hong Kong (US$9.34/kg) and Vietnam (US$8.14/kg), China’s average was US$3.79/kg in 2015 and US$3.43/kg in 2025, against US$4.25/kg and US$3.69/kg for all destinations (our calculation from UN Comtrade).
Regional patterns: North Africa, West Africa, Central Asia and the rest
Grouped by the UN’s M49 regions, North and West Africa took 59.9% of China’s tea export volume in 2025, against 50.3% in 2015 (our calculation).
Chinese tea exports by region, 2015, 2020 and 2025 (tonnes and share of volume; source: UN Comtrade via WITS)
| Region | 2015 (t) | 2020 (t) | 2025 (t) | Share 2015 | Share 2025 | Change 2015–2025 |
|---|---|---|---|---|---|---|
| North Africa | 88,007 | 88,250 | 121,822 | 27.1% | 29.1% | +38.4% |
| West Africa | 75,352 | 94,596 | 128,925 | 23.2% | 30.8% | +71.1% |
| Central Africa | 9,126 | 14,642 | 21,539 | 2.8% | 5.1% | +136.0% |
| Central Asia | 32,153 | 27,667 | 38,730 | 9.9% | 9.2% | +20.5% |
| Russia | 12,771 | 14,812 | 16,038 | 3.9% | 3.8% | +25.6% |
| East Asia | 24,929 | 27,027 | 15,872 | 7.7% | 3.8% | −36.3% |
| South-east Asia | 12,620 | 21,170 | 17,794 | 3.9% | 4.2% | +41.0% |
| Southern and Western Asia | 18,133 | 16,297 | 10,612 | 5.6% | 2.5% | −41.5% |
| Europe excluding Russia | 29,574 | 31,133 | 33,418 | 9.1% | 8.0% | +13.0% |
| North America | 17,697 | 10,554 | 11,587 | 5.4% | 2.8% | −34.5% |
| Rest of the world | 4,589 | 2,666 | 2,420 | 1.4% | 0.6% | −47.3% |
Regions are built from UN M49 sub-regions: Central Africa is M49’s “Middle Africa”, Southern and Western Asia combines two sub-regions, and UN Comtrade’s “Other Asia, nes” and the few rows for Eastern and Southern Africa are counted in the rest of the world. Shares and changes are our calculation.
North Africa. Morocco makes up three-quarters of the region’s volume (91,393 of 121,822 tonnes in 2025). Algeria barely changed over ten years (+6.5%), while Libya almost doubled (+97.0%). The three buy different formats: in 2025, 99.7% of Morocco’s green tea came in packings over 3 kg (HS 0902.20), against 76.3% of Algeria’s, while 97.7% of Libya’s arrived in packs of 3 kg or less (HS 0902.10; our calculation). How Morocco imports green tea is explained in a separate guide.
West Africa. Volume rose 71.1%, from 75,352 to 128,925 tonnes, lifting the region’s share from 23.2% to 30.8%. Côte d’Ivoire, Niger, Ghana, Mali, Mauritania and Senegal grew; Togo fell 80.6%. Mauritania climbed from eighth to fourth (+56.4%), and all of its tea came in packs of 3 kg or less in 2025, as did 96.2% to 99.8% of the green tea for Senegal, Ghana, Côte d’Ivoire, Mali and Gambia (our calculation). See our guide to Mauritania’s green tea trade, and our West African tea import duties guide for the taxes on arrival.
Central Africa. Chad and Cameroon account for 21,122 of the group’s 21,539 tonnes. Chad’s purchases grew nearly elevenfold. Both buy green tea in packings over 3 kg, with unit values of about US$1/kg: US$1.12/kg for Chad and US$0.88/kg for Cameroon under HS 0902.20 in 2025 (our calculation).
Central Asia. Uzbekistan, second in 2015, 2020 and 2025, takes three-quarters of the region’s tea (29,217 of 38,730 tonnes), 98.7% of it green tea in packings over 3 kg, with a unit value of US$2.09/kg (our calculation). The region grew 20.5%, less than China’s total, so its share slipped from 9.9% to 9.2%.
Russia. Volume grew 25.6%, from 12,771 to 16,038 tonnes, keeping Russia’s share near 4%; 27.5% of its 2025 volume was black or partly fermented tea (our calculation).
East Asia. Volume fell 36.3%, to 15,872 tonnes, as Hong Kong fell 65.0% and Japan 14.4%. Japan is the only top-20 market where black and partly fermented tea outweighs green tea.
Europe, North America and the rest. Europe outside Russia grew 13.0%: Poland nearly quadrupled while Germany fell 23.8%. North America lost 34.5%, almost all of it in the United States. Southern and Western Asia fell 41.5%, almost entirely in Pakistan (6,620 to 1,775 tonnes) and Iran (2,713 to 115 tonnes). South-east Asia rose 41.0% in volume, with gains in Thailand, Vietnam, Malaysia and Indonesia.
How the figures were compiled
- MOFCOM. The December issue of its monthly tea report (中国出口月度统计报告 茶叶) covers the full year: totals, continents and the ten largest destinations by value. Its annual totals match China’s HS 0902 figures in UN Comtrade to within 6 tonnes in 2015 and 1 tonne in 2020 and 2025.
- UN Comtrade (via WITS). China’s declarations by partner (126 entries in 2015, 136 in 2025), used for all the rankings in the tables. They match MOFCOM’s country figures to within 0.1 tonne in 2020 and 2025; in 2015 three differ slightly: the United States in volume (16,356 against 16,360 tonnes), and Morocco, Hong Kong and the United States in value (by US$0.1 to 0.2 million).
- Computed figures. Shares use MOFCOM’s annual totals, and regional shares UN Comtrade’s world total (either total gives the same shares to one decimal); unit values are FOB value ÷ volume; volumes are rounded to the tonne. Figures checked on 3 October 2026.
What ten years of data mean for buyers
- Concentration. The 20 largest destinations took 82.0% of the volume in 2015 and 82.7% in 2025, and Morocco alone 19.8% and 21.8%.
- Africa. Nearly two tonnes in every three now go to Africa, against just over half in 2015.
- Volatility. Beyond Morocco and Uzbekistan, ranks move fast: Togo went from fourth in 2020 to 30th in 2025, Côte d’Ivoire from 33rd to sixth. One year of data is a weak basis for sizing a market.
- Unit values. Compare like with like: the same destination, HS subheading and year.
Questions and answers
Which countries import the most tea from China?
Morocco, by a wide margin: it received 91,393 tonnes in 2025, 21.8% of China's tea export volume (MOFCOM; share our calculation). Uzbekistan (29,217 t), Senegal (24,449 t), Mauritania (20,117 t) and Ghana (18,075 t) came next, according to UN Comtrade.
Where does most Chinese tea go?
To Africa, which took 65.1% of China's tea export volume in 2025, against 53.2% in 2015 (MOFCOM; shares our calculation). West Africa received 30.8% and North Africa 29.1% of the 2025 volume, according to our calculation from UN Comtrade using the UN's M49 regions.
How have China's tea export markets changed since 2015?
Volume grew 28.9% between 2015 and 2025, or 2.6% a year (our calculation from MOFCOM), and most of the extra tonnes went to Africa. Côte d'Ivoire, Chad, Niger and Poland entered the top 20 destinations, Togo, Hong Kong, Pakistan and France left it, and shipments to the United States fell 36.1% (our calculation from UN Comtrade).
What is the export price of Chinese tea by country?
Customs statistics give unit values, not prices. In 2025, FOB value divided by volume ranged from US$0.91 per kg for Cameroon to US$6.35 per kg for the United States among the 20 largest destinations, with Morocco at US$3.04 (our calculation from MOFCOM and UN Comtrade). The average for all destinations was US$3.69 per kg (MOFCOM).
How much tea does China export to Morocco each year?
Between 59,832 tonnes (2023) and 91,393 tonnes (2025) over 2015–2025, according to MOFCOM's December reports. Morocco took 64,438 tonnes in 2015 and 67,159 tonnes in 2020.
Which West African countries buy the most Chinese tea?
In 2025, Senegal (24,449 t), Mauritania (20,117 t), Ghana (18,075 t), Côte d'Ivoire (16,701 t), Niger (11,082 t) and Mali (10,326 t), according to MOFCOM and UN Comtrade. West Africa as a whole received 128,925 tonnes, against 75,352 tonnes in 2015 (our calculation).
Sources
- 1. MOFCOM and 中国食品土畜进出口商会: China export monthly statistical report, tea, December 2025 (in Chinese) · wms.mofcom.gov.cn
- 2. MOFCOM and 中国食品土畜进出口商会: China export monthly statistical report, tea, December 2020 (in Chinese) · wms.mofcom.gov.cn
- 3. MOFCOM Department of Foreign Trade: China export monthly statistical report, tea, December 2015 (in Chinese) · wms.mofcom.gov.cn
- 4. MOFCOM Department of Foreign Trade: archive of the monthly tea export reports, including the December reports for 2016 to 2024 (in Chinese) · wms.mofcom.gov.cn
- 5. UN Comtrade via WITS: China tea exports (HS 0902) by partner, 2025 · wits.worldbank.org
- 6. UN Comtrade via WITS: China tea exports (HS 0902) by partner, 2020 · wits.worldbank.org
- 7. UN Comtrade via WITS: China tea exports (HS 0902) by partner, 2015 · wits.worldbank.org
- 8. UN Comtrade via WITS: China exports of green tea in packs of 3 kg or less (HS 0902.10) by partner, 2025 · wits.worldbank.org
- 9. UN Comtrade via WITS: China exports of other green tea (HS 0902.20) by partner, 2025 · wits.worldbank.org
- 10. UN Comtrade via WITS: China exports of black and partly fermented tea in packs of 3 kg or less (HS 0902.30) by partner, 2025 · wits.worldbank.org
- 11. UN Comtrade via WITS: China exports of other black and partly fermented tea (HS 0902.40) by partner, 2025 · wits.worldbank.org
- 12. National Bureau of Statistics of China: statistical scope and grouping of total imports and exports (进出口总额的统计范围和统计分组), 29 November 2024 (in Chinese) · stats.gov.cn
- 13. United Nations Statistics Division: Standard country or area codes for statistical use (M49) · unstats.un.org
- 14. World Customs Organization: Harmonized System Nomenclature 2022, Chapter 9 (coffee, tea, maté and spices) · wcoomd.org