China Tea Exports 2025: Statistics by Type and Country
China exported 418,757 tonnes of tea worth US$1.55 billion in 2025 (+11.9%). Official figures by tea type, country, pack size, province and price.
Key facts
- China exported 418,757 tonnes of tea worth US$1.55 billion in 2025, up 11.9% in volume and 8.9% in value on 2024, according to MOFCOM.
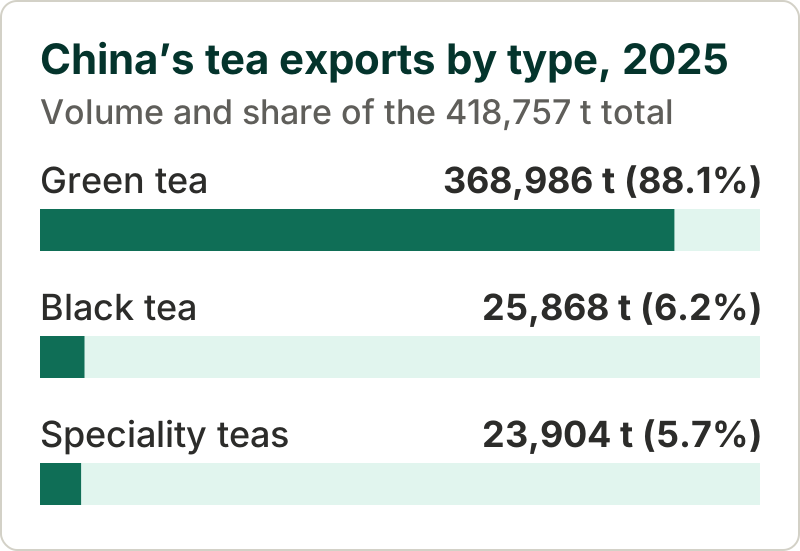
- Green tea made up 88.1% of China's tea export volume in 2025, with 368,986 tonnes worth US$1,242.8 million, according to MOFCOM and CTMA figures.
- Morocco was the first destination for Chinese tea by value in 2025, according to MOFCOM, receiving 91,393 tonnes worth US$278.1 million.
- In 2025, 15 West African countries received 128,925 tonnes of Chinese tea between them, 30.8% of China's export volume, and 90.9% of their green tea arrived in packs of 3 kg or less (our calculation from UN Comtrade data).
- From January to April 2026, China's tea export volume was flat (−0.1%) while the average export price rose 10.3% to US$3,857.4 per tonne, according to MOFCOM.
China exported 418,757 tonnes of tea worth US$1.55 billion in 2025, according to China’s Ministry of Commerce (MOFCOM): volume rose 11.9% on 2024 and value 8.9%, while the average export price slipped 2.7% to US$3.69 per kg. Green tea made up 88.1% of the volume. Morocco ranked first by value (MOFCOM) and by volume (UN Comtrade) with 91,393 tonnes, while 15 West African countries together took 128,925 tonnes (our calculation from UN Comtrade).
China tea export statistics for 2025
MOFCOM’s monthly tea export report groups tea by eight-digit customs (HS) codes. For the ten countries it details, its 2025 figures match those China reported to UN Comtrade, apart from rounding (the largest gap is 0.1 tonne).
China’s tea exports, full year 2025 (tonnes and US dollars; source: MOFCOM)
| Indicator | 2025 | Change on 2024 |
|---|---|---|
| Volume | 418,757 t | +11.9% |
| Value | US$1,545.7 million | +8.9% |
| Average export price | US$3.69/kg | −2.7% |
| Exports to Africa | 272,790 t (65.1% of volume) | +14.9% |
| Exports to Asia | 83,074 t (19.8%) | +11.0% |
| Exports to Europe | 49,456 t (11.8%) | +3.9% |
The rebound followed a weak 2024, when volume grew 1.8% but value fell 18.4% to US$1.42 billion as the average price dropped 19.8%.
Exports by tea type
MOFCOM reports three groups: green, black and speciality teas. The China Tea Marketing Association (CTMA), citing customs statistics, gives volumes but no values for eight categories, including six that MOFCOM does not show separately.
Exports by tea type, 2025 (tonnes, US$ million, US$/kg; source: MOFCOM)
| Type | Volume (t) | Share of volume | Volume change | Value (US$ million) | US$/kg |
|---|---|---|---|---|---|
| Green tea | 368,986 | 88.1% | +13.9% | 1,242.8 | 3.37 |
| Black tea | 25,868 | 6.2% | +4.5% | 136.0 | 5.26 |
| Speciality teas | 23,904 | 5.7% | −6.3% | 166.9 | 6.98 |
Rounded figures may not add up exactly.
 Source: MOFCOM (2025)
Green tea earned 80.4% of export value (our calculation). Black tea volume rose 4.5%, but its value fell 20.9% because its average price dropped 24.3%.
Other tea categories, 2025 (tonnes; source: CTMA, volumes only)
| Category | Volume (t) | Share of China’s tea export volume | Volume change |
|---|---|---|---|
| Oolong | 13,900 | 3.3% | −10.1% |
| Jasmine tea | 7,510 | 1.8% | +0.3% |
| Ripe pu-erh | 1,401 | 0.3% | −3.0% |
| White tea | 477 | 0.1% | +4.6% |
| Dark tea | 472 | 0.1% | −7.9% |
| Other scented tea | 147 | 0.04% | +6.8% |
These six categories add up to about 23,900 tonnes, close to MOFCOM’s speciality total, but neither source says how CTMA’s categories map onto MOFCOM’s groups.
China tea exports by country
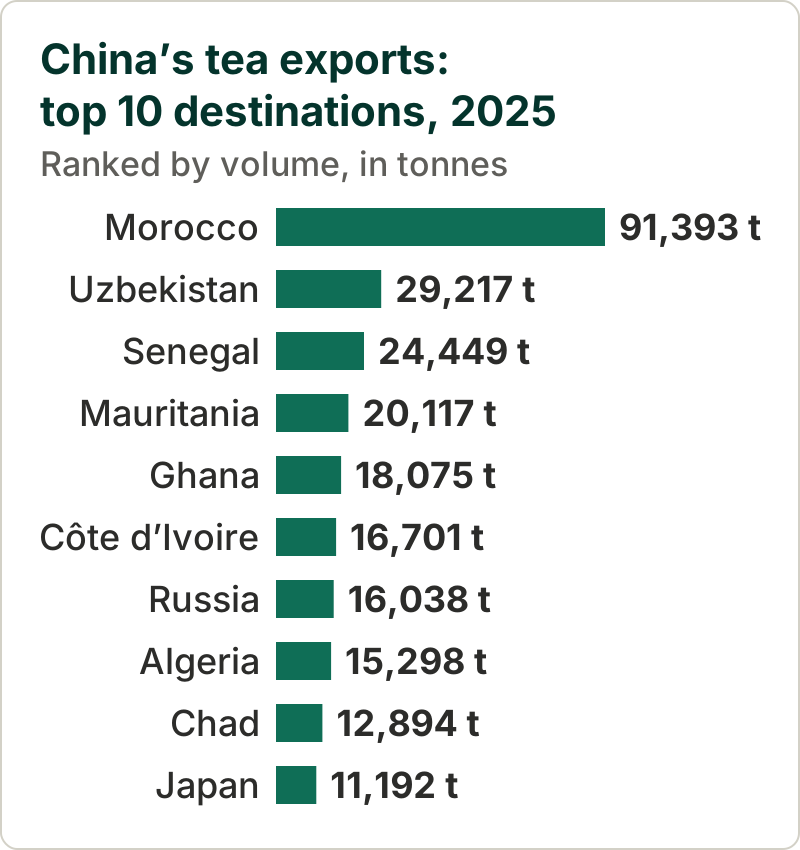
Destinations ranked by volume, 2025 (tonnes, US$ million, US$/kg)
| Rank | Country | Volume (t) | Volume change | Value (US$ million) | US$/kg |
|---|---|---|---|---|---|
| 1 | Morocco | 91,393 | +13.4% | 278.1 | 3.04 |
| 2 | Uzbekistan | 29,217 | +17.3% | 61.5 | 2.11 |
| 3 | Senegal | 24,449 | +61.4% | 98.4 | 4.02 |
| 4 | Mauritania | 20,117 | +26.8% | 83.2 | 4.14 |
| 5 | Ghana | 18,075 | −53.2% | 72.4 | 4.00 |
| 6 | Côte d’Ivoire | 16,701 | +300.4% | 71.1 | 4.26 |
| 7 | Russia | 16,038 | −4.5% | 48.6 | 3.03 |
| 8 | Algeria | 15,298 | +10.9% | 53.9 | 3.52 |
| 9 | Chad | 12,894 | +142.1% | 15.0 | 1.16 |
| 10 | Japan | 11,192 | +9.7% | 64.1 | 5.73 |
| 11 | Niger | 11,082 | +13.8% | 31.3 | 2.83 |
| 12 | United States | 10,456 | −11.8% | 66.4 | 6.35 |
| 13 | Mali | 10,326 | +56.3% | 41.3 | 4.00 |
| 14 | Libya | 9,862 | +48.5% | 29.3 | 2.97 |
| 15 | Germany | 9,503 | −0.2% | 44.3 | 4.66 |
Sources: MOFCOM; UN Comtrade (via WITS) for the volume ranking and for Russia, Chad, Niger, Mali, Libya and Germany, whose volume change is our calculation. US$/kg is our calculation (value divided by volume).
 Sources: MOFCOM; UN Comtrade via WITS (2025)
Morocco took 21.8% of China’s tea export volume and 18.0% of its value (our calculation from MOFCOM figures), more than Uzbekistan, Senegal and Mauritania combined. Ranked by value, the order changes: Senegal comes second (US$98.4 million) and Malaysia third, with US$84.9 million for only 4,008 tonnes, about US$21 per kg. How the top destinations have changed since 2015 is shown in our guide to China’s tea export markets, 2015–2025.
Taken together, West Africa took more Chinese tea than Morocco in 2025. The 15 West African countries in China’s 2025 export data (Senegal, Mauritania, Ghana, Côte d’Ivoire, Niger, Mali, the Gambia, Benin, Guinea, Togo, Nigeria, Burkina Faso, Sierra Leone, Liberia and Guinea-Bissau) received 128,925 tonnes worth US$488.2 million: 30.8% of China’s export volume, up 8.9% on 2024 (our calculation from UN Comtrade). Growth was uneven. Côte d’Ivoire quadrupled, Senegal rose 61.4%, Mali 56.3% and Guinea 35.8%, while Ghana fell 53.2% and Togo 54.8%. The customs data do not say why.
Green tea exports by country and pack size
Customs codes separate green tea in immediate packings of 3 kg or less (HS 0902.10) from larger packings (HS 0902.20). Together they cover more than MOFCOM’s green tea group: in MOFCOM’s code list, that group contains only codes 09021090 and 09022090, and the other eight-digit codes it lists under these two headings count as speciality tea. The two headings totalled 377,120 tonnes in 2025, against 368,986 for MOFCOM’s green tea.
Green tea exports by pack size, 2025 (tonnes; source: UN Comtrade via WITS)
| Destination | Packs of 3 kg or less | Packings over 3 kg | Share in packs of 3 kg or less |
|---|---|---|---|
| Morocco | 252 | 91,128 | 0.3% |
| Uzbekistan | 123 | 28,840 | 0.4% |
| Algeria | 3,604 | 11,622 | 23.7% |
| Senegal | 23,527 | 922 | 96.2% |
| Mauritania | 20,117 | – | 100% |
| Ghana | 17,757 | 317 | 98.2% |
| Côte d’Ivoire | 16,511 | 150 | 99.1% |
| Mali | 10,303 | 23 | 99.8% |
| Niger | 7,157 | 3,925 | 64.6% |
| Benin | 4,091 | 3,897 | 51.2% |
| All destinations | 145,506 | 231,614 | 38.6% |
– = none recorded.
Morocco and Uzbekistan import almost all their green tea in packings over 3 kg (99.7% and 99.6%). Across the 15 West African countries, 90.9% of the green tea arrived in packs of 3 kg or less, so it was packed before leaving China: over 95% in 12 of them, while Niger and Benin took both formats and Nigeria took mainly larger packings (shares are our calculation). HS 0902.10 covers any packing up to 3 kg, so the data cannot tell retail packs from 1–3 kg bags. The unit value of Morocco’s green tea in larger packings was US$3.04/kg, against US$4.05/kg for Senegal’s and US$4.26/kg for Côte d’Ivoire’s packed green tea (our calculation); customs values do not separate the tea from its packing.
Exporting provinces
Tea exports by province, 2025, ranked by value (tonnes, US$ million; source: MOFCOM)
| Province | Volume (t) | Volume change | Value (US$ million) | Value change |
|---|---|---|---|---|
| Zhejiang | 185,297 | +18.4% | 560.0 | +18.7% |
| Anhui | 73,491 | +7.8% | 280.7 | +12.9% |
| Fujian | 20,847 | −0.1% | 169.7 | −6.5% |
| Hunan | 55,668 | +14.6% | 155.8 | +12.9% |
| Hubei | 30,809 | +9.2% | 115.5 | −3.6% |
| Jiangxi | 11,753 | +2.2% | 60.5 | −5.9% |
| Guangdong | 4,332 | +13.8% | 33.8 | +29.1% |
| Guizhou | 4,787 | −4.2% | 31.6 | −9.7% |
| Henan | 7,773 | +9.8% | 29.4 | −18.8% |
| Shaanxi | 4,356 | +117.9% | 22.1 | +91.9% |
Zhejiang alone shipped 44.2% of the volume; with Anhui and Hunan, the share reaches 75.1%. Fujian ranks third by value on 5.0% of the volume, at US$8.14/kg (shares and unit value are our calculation). MOFCOM’s report does not say whether a province is the exporter’s location or the tea’s origin.
Average export prices
MOFCOM’s average export price for 2025 was US$3,691.2 per tonne (US$3.69/kg). By continent it was US$3.24/kg for Africa, US$3.92/kg for Europe, US$4.58/kg for Asia and US$6.59/kg for North America. These are customs unit values (declared value divided by quantity) that mix grades and pack sizes; they are not the price of any particular tea. Our guides to chunmee grades, gunpowder grades and Chinese black tea grades explain what separates one grade from the next.
2026 so far: January to April
At the end of September 2026, the most recent MOFCOM monthly report we could open covered January to April 2026. Over those four months China exported 133,896 tonnes (−0.1% year on year) worth US$516.5 million (+10.2%). The average price rose 10.3% to US$3.86/kg, and 14.8% for green tea, to US$3.68/kg. Morocco was flat at 29,512 tonnes (−0.7%) and Senegal fell 18.2%, while Mauritania (+49.4%), Côte d’Ivoire (+88.4%) and Mali (+59.0%) kept growing.
What the numbers mean for buyers
- Prices. The average export price fell 2.7% in 2025 but was 10.3% higher in January–April 2026 than a year earlier. As a customs unit value, it reflects the mix of grades and pack sizes as well as prices.
- Pack format. In 12 of the 15 West African markets, more than 95% of the green tea arrived in packs of 3 kg or less, so it was packed before leaving China. Morocco and Uzbekistan import almost only green tea in packings over 3 kg. How many cartons fit in a container depends on their size and on the tea’s density (tea container capacity).
- Provinces. Three provinces, Zhejiang, Anhui and Hunan, shipped three tonnes in every four.
- Volatility. Single-country figures swing sharply from year to year (Ghana −53.2%, Côte d’Ivoire +300.4% in 2025), so one year of data is a weak basis for sizing a market.
Questions and answers
How much tea did China export in 2025?
China exported 418,757 tonnes of tea worth US$1.55 billion in 2025, according to MOFCOM. Volume rose 11.9% and value 8.9% compared with 2024.
Which country is the main buyer of Chinese tea?
Morocco: in 2025 it ranked first by value (MOFCOM) and by volume (UN Comtrade), receiving 91,393 tonnes of Chinese tea worth US$278.1 million, 21.8% of China's tea export volume (our calculation). Uzbekistan came second by volume and Senegal second by value.
What share of China's tea exports is green tea?
Green tea accounted for 88.1% of China's tea export volume in 2025 (368,986 tonnes) and 80.4% of its value, according to our calculation from MOFCOM figures; CTMA gives the same 88.1% volume share.
What was the average export price of Chinese tea in 2025?
MOFCOM puts it at US$3,691.2 per tonne, about US$3.69 per kg, 2.7% lower than in 2024. Green tea averaged US$3.37 per kg and black tea US$5.26 per kg.
How are China's tea exports split by province?
According to MOFCOM, Zhejiang shipped 185,297 tonnes in 2025, 44.2% of China's tea export volume (our calculation), followed by Anhui (73,491 tonnes) and Hunan (55,668 tonnes). MOFCOM does not say whether a province is the exporter's location or the tea's origin.
Are China's tea exports growing in 2026?
Not in volume: from January to April 2026, China exported 133,896 tonnes of tea (−0.1%), but value rose 10.2% to US$516.5 million because the average price was 10.3% higher (MOFCOM).
Sources
- 1. MOFCOM and 中国食品土畜进出口商会: China export monthly statistical report, tea, December 2025 (in Chinese) · wms.mofcom.gov.cn
- 2. MOFCOM and 中国食品土畜进出口商会: China export monthly statistical report, tea, December 2024 (in Chinese) · wms.mofcom.gov.cn
- 3. MOFCOM and 中国食品土畜进出口商会: China export monthly statistical report, tea, April 2026 (in Chinese) · wms.mofcom.gov.cn
- 4. China Tea Marketing Association (CTMA): brief on China's tea imports and exports in 2025 (in Chinese) · ctma.com.cn
- 5. UN Comtrade via WITS: China tea exports (HS 0902) by partner, 2025 · wits.worldbank.org
- 6. UN Comtrade via WITS: China tea exports (HS 0902) by partner, 2024 · wits.worldbank.org
- 7. UN Comtrade via WITS: China exports of green tea in packs of 3 kg or less (HS 0902.10) by partner, 2025 · wits.worldbank.org
- 8. UN Comtrade via WITS: China exports of other green tea (HS 0902.20) by partner, 2025 · wits.worldbank.org
- 9. World Customs Organization: Harmonized System Nomenclature 2022, Chapter 9 (coffee, tea, maté and spices) · wcoomd.org