China tea exports by month: January to August 2026
China tea exports by month: 28,894 t in August 2026 (−18.4% on August 2025) and 252,494 t from January to August (−6.1%), per China Customs data.

Key facts
- China exported 28,894 tonnes of tea worth US$119.8 million in August 2026, 18.4% less in volume and 15.2% less in value than in August 2025, according to China's General Administration of Customs (GACC).
- From January to August 2026, China exported 252,494 tonnes of tea worth US$990.8 million, 6.1% less in volume but 1.4% more in value than in the same months of 2025, according to GACC figures (changes: The Tea Trade's calculation, with MOFCOM's 2025 figures).
- The average unit value of China's tea exports was US$3.92 per kg from January to August 2026, 8.0% more than a year earlier, and it was higher than in the same month of 2025 in each of the eight months, according to The Tea Trade's calculation from GACC and MOFCOM figures.
- China's tea export volume was flat from January to April 2026 (−0.1%, according to MOFCOM) but 12.0% lower from May to August, at 118,598 tonnes, than in the same months of 2025, according to The Tea Trade's calculation from GACC and MOFCOM figures.
- In April 2026, the latest month broken down by destination in MOFCOM's monthly reports on 14 October 2026, Morocco (6,932 tonnes), Mauritania (2,936 tonnes) and Senegal (1,836 tonnes) were the three largest buyers of Chinese tea by value.
China exported 28,894 tonnes of tea worth US$119.8 million in August 2026, 18.4% less in volume and 15.2% less in value than in August 2025, according to China’s General Administration of Customs (GACC). From January to August 2026, China’s tea exports came to 252,494 tonnes worth US$990.8 million: 6.1% less in volume than a year earlier but 1.4% more in value, as the average unit value rose 8.0% to US$3.92 per kg (The Tea Trade’s calculation from GACC and Ministry of Commerce figures). This page follows China’s tea exports month by month and is updated when customs publishes each new month.
China’s tea exports by month in 2026
China’s customs administration (海关总署) publishes a tea line, covering HS heading 0902, in the table of major export commodities of its Monthly Bulletin. On 14 October 2026 that table covered every month from January to August 2026. Against the same month of 2025, volume fell in five of the eight months, rose in February and April and was unchanged in June, while value rose in four months and fell in four.
China’s tea exports by month, 2026 against 2025 (HS 0902; tonnes and US$ million; sources: GACC for 2026 and the monthly changes, MOFCOM for 2025)
| Month | 2026 (t) | 2025 (t) | Change | 2026 (US$ million) | 2025 (US$ million) | Change |
|---|---|---|---|---|---|---|
| January | 39,656 | 43,510 | −8.9% | 153.5 | 150.7 | +1.9% |
| February | 28,555 | 22,376 | +27.6% | 113.6 | 78.8 | +44.2% |
| March | 32,010 | 35,066 | −8.7% | 119.0 | 120.6 | −1.3% |
| April | 33,675 | 33,104 | +1.7% | 130.3 | 118.6 | +9.9% |
| May | 29,387 | 34,301 | −14.3% | 112.7 | 123.9 | −9.1% |
| June | 32,302 | 32,293 | 0.0% | 126.5 | 122.8 | +3.0% |
| July | 28,014 | 32,832 | −14.7% | 115.3 | 120.3 | −4.2% |
| August | 28,894 | 35,414 | −18.4% | 119.8 | 141.2 | −15.2% |
| January–August | 252,494 | 268,897 | −6.1% | 990.8 | 976.9 | +1.4% |
The 2026 months come from GACC’s tables, dated between 8 March and 18 September 2026. The 2025 months come from the monthly reports of China’s Ministry of Commerce (MOFCOM): every monthly change GACC publishes for 2026 can be recalculated from them. The January–August changes are The Tea Trade’s calculation; the China Tea Marketing Association (CTMA), quoting customs data, gives the same rounded changes. The months may not add up exactly to the January–August total, because the figures are rounded and GACC revises earlier months.
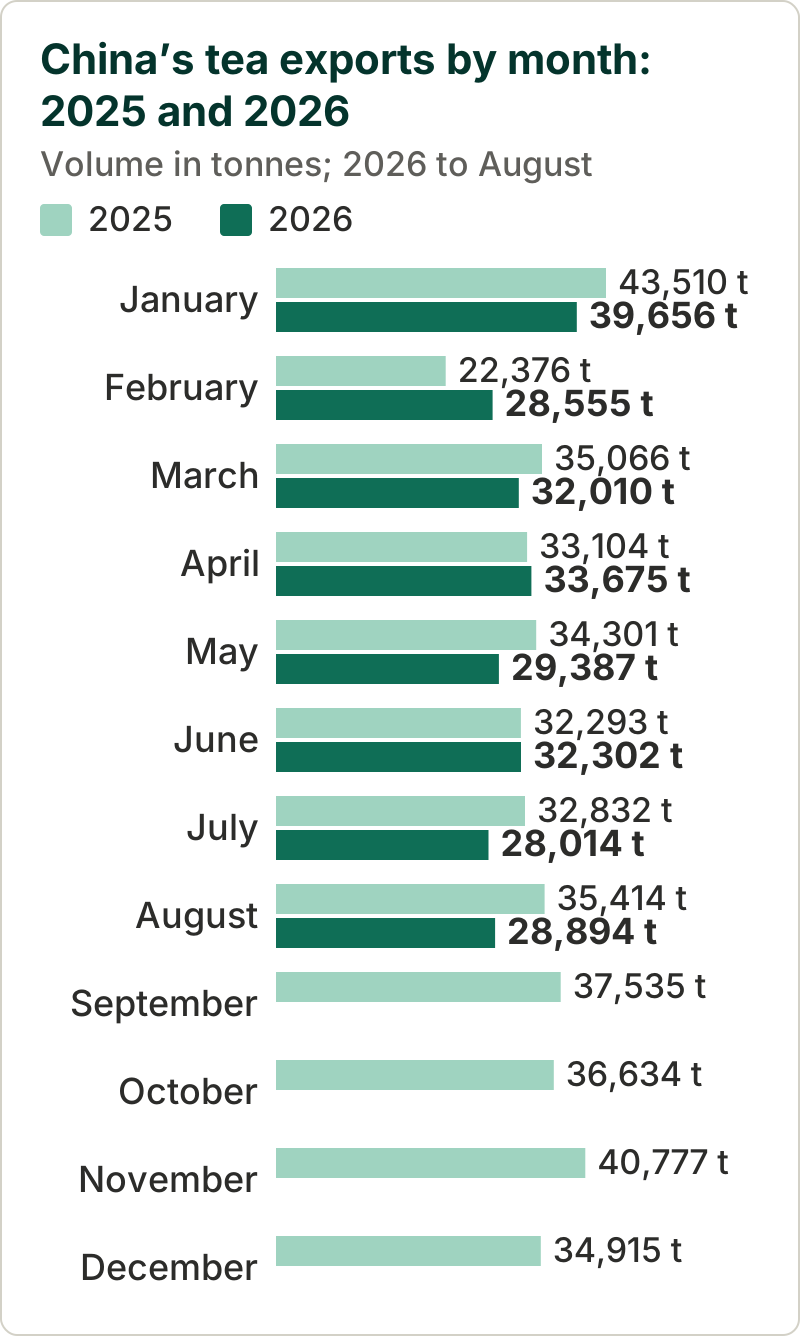 Sources: GACC Monthly Bulletin (2026); MOFCOM monthly reports (2025)
Unit values moved the other way. In each month from January to August, the declared value per kilogram was higher than in the same month of 2025, by 3.0% to 13.0%, so value held up better than volume.
Average unit value of China’s tea exports by month, 2026 against 2025 (US$ per kg; The Tea Trade’s calculation, value ÷ volume, from GACC figures for 2026 and MOFCOM figures for 2025)
| Month | 2026 | 2025 | Change |
|---|---|---|---|
| January | 3.87 | 3.46 | +11.8% |
| February | 3.98 | 3.52 | +13.0% |
| March | 3.72 | 3.44 | +8.2% |
| April | 3.87 | 3.58 | +8.0% |
| May | 3.84 | 3.61 | +6.2% |
| June | 3.92 | 3.80 | +3.0% |
| July | 4.12 | 3.66 | +12.3% |
| August | 4.14 | 3.99 | +3.9% |
| January–August | 3.92 | 3.63 | +8.0% |
For January to April 2026, MOFCOM publishes the same averages, in US dollars per tonne, and the same changes. A unit value averages every type, grade and pack size of tea shipped in the month; it is not the price of any particular tea, as our guide to green tea export unit values explains.
January to August 2026 against the same months of 2025
The year so far falls into two halves. From January to April, China exported 133,896 tonnes of tea, 0.1% less than a year earlier, for US$516.5 million (+10.2%), according to MOFCOM. From May to August, it exported 118,598 tonnes, 12.0% less than in May–August 2025, for US$474.3 million (−6.7%; The Tea Trade’s calculation from GACC and MOFCOM figures). The unit value rose less in the second period: by 10.3% in January–April, to US$3.86 per kg (MOFCOM), and by 6.1% in May–August, to US$4.00 per kg (The Tea Trade’s calculation). Volume fell by more than 14% in May, July and August, while June matched June 2025.
Single months swing. February 2026 was 27.6% above February 2025, after a January 8.9% below. GACC first releases January and February together, and taken together they came to 68,211 tonnes, 3.5% more than in 2025, according to MOFCOM. January was the largest month of 2026 so far, with 39,656 tonnes, and July the smallest, with 28,014. In 2025, monthly volume ranged from 22,376 tonnes in February to 43,510 tonnes in January. August 2026 was 3.1% above July in volume (The Tea Trade’s calculation).
The customs figures do not say why volume fell over the summer, and MOFCOM’s reports, which break the totals down by destination and tea type, stopped at April on 14 October 2026. Full-year figures for 2025, by tea type, destination, pack size and province, are in our guide to China’s tea exports in 2025.
Main destinations: April 2026, the latest month MOFCOM has broken down
GACC’s Monthly Bulletin gives no breakdown of tea by destination. MOFCOM’s monthly reports list the ten largest destinations by value for each month; on 14 October 2026 the latest covered April 2026, and none covered May to August, so no later destinations are shown here.
Ten largest destinations for Chinese tea by value, April 2026 (tonnes, US$ million and change on April 2025; source: MOFCOM)
| Rank by value | Country | Volume (t) | Change | Value (US$ million) | Change |
|---|---|---|---|---|---|
| 1 | Morocco | 6,932 | +14.1% | 22.8 | +23.9% |
| 2 | Mauritania | 2,936 | +48.5% | 12.3 | +56.0% |
| 3 | Senegal | 1,836 | −28.3% | 7.4 | −28.7% |
| 4 | Côte d’Ivoire | 1,503 | +299.7% | 7.2 | +350.4% |
| 5 | Japan | 1,113 | +17.7% | 5.9 | +29.0% |
| 6 | Uzbekistan | 1,939 | +2.6% | 5.4 | +43.6% |
| 7 | Algeria | 1,516 | +10.6% | 5.1 | −5.8% |
| 8 | United States | 778 | +39.6% | 5.0 | +104.6% |
| 9 | Mali | 1,133 | +112.2% | 4.7 | +105.7% |
| 10 | Germany | 627 | −20.9% | 4.0 | +43.2% |
Together these ten took 60.3% of April’s tea export volume and 61.2% of its value, and Morocco alone 20.6% of the volume (The Tea Trade’s calculation). Africa received 22,679 tonnes, 5.1% more than in April 2025. Because MOFCOM lists only the first ten by value, the table cannot rank destinations by volume: a market with a low unit value can take more tonnes and still be left out. Over January to April, Morocco, Mauritania and Côte d’Ivoire were the first three by value. How these markets have moved since 2015 is traced in our guide to Chinese tea export markets.
When China’s monthly tea export figures are published
Monthly sources on China’s tea exports and when they appeared in 2026 (sources: GACC, CTMA, MOFCOM)
| Source | What it gives for tea | When it appears |
|---|---|---|
| GACC preliminary release | No tea line: trade totals and a short list of goods | English tables dated the 6th to the 15th of the following month (6 March to 9 September 2026) |
| GACC Monthly Bulletin, table (13), “Major Export Commodities in Quantity and Value” | Tea (HS 0902): tonnes and US$ thousand for the month and the year to date, and the change on the same month a year earlier | The 18th of the following month in GACC’s 2025 calendar; the August 2026 table is dated 18 September 2026 |
| CTMA monthly briefing (中国茶叶进出口情况简报) | The same customs totals, with year-to-date changes and average prices | Posted the 20th to the 22nd of the following month; 20 September 2026 for August |
| MOFCOM monthly report (中国出口月度统计报告 茶叶) | Ten largest destinations by value, provinces, tea types and customs regimes, for the month and the year to date | Months later: on 14 October 2026 the latest covered April 2026, in a file dated 3 July 2026 on MOFCOM’s server |
GACC’s release calendar for 2025, the latest on its English site, set the preliminary release between the 7th and the 14th of the month, the Monthly Bulletin on the 18th and the online query on the 20th; the online query, according to GACC, gives detailed commodities and trading partners. The preliminary data for January and February come out together in March. On GACC’s English site, which listed no 2026 calendar on 14 October 2026, the 2026 tables carrying the tea line are dated 8 March for January–February, 8 April for March, and between the 18th and the 22nd of the following month for April to August.
MOFCOM is slower. On its server, the files of its reports for January to October 2025 are dated 18 and 19 December 2025, those for November and December 2025 23 March 2026, those for January and February 2026 26 March 2026, and those for March and April 2026 3 July 2026. On 14 October 2026 its archive listed none for May or later. MOFCOM’s reports also break exports down by province, the subject of our guide to China’s tea exports by province.
How this page is updated
The page is updated in the order in which the sources appear.
- Around the 18th of each month: GACC. The new month’s tea line is read from table (13), “Major Export Commodities in Quantity and Value”, of GACC’s Monthly Bulletin on its English site (row “Tea”, unit T, values in US$ thousand). The month’s volume, value and change go into the first table and the chart, beside the same month of 2025 from MOFCOM’s report. The January-to-date row takes GACC’s cumulative figures, and its changes are recalculated against MOFCOM’s January-to-date figures for 2025 (the sum of table 12 in its report for the same month). Unit values, their changes and the change on the previous month are recalculated from volume and value.
- Around the 20th: cross-check. CTMA’s monthly briefing quotes the same customs figures, rounded, with the year-to-date changes; both sources are compared before the page changes.
- When MOFCOM posts a new report. The destinations table moves to the latest month MOFCOM covers, and MOFCOM’s totals for that month are checked against GACC’s.
- Revisions. GACC states that its latest release is the more accurate one, so the January-to-date row always follows GACC’s latest table, and earlier months are corrected when a later GACC or MOFCOM release revises them.
- A new year. When the first figures for 2027 appear, January and February together, 2026 becomes the comparison year: each 2026 month is taken from the latest GACC or MOFCOM release and kept only if it reproduces the change GACC publishes for the same month of 2027.
Figures checked on 14 October 2026.
Reading the monthly figures
- Scope. The “Tea” line in GACC’s table is HS heading 0902, in tonnes, according to GACC’s list of the codes behind each line; our guide to tea HS codes explains its four subheadings. For January to April 2026, MOFCOM’s monthly totals match GACC’s to the tonne and to the thousand dollars.
- Revisions. GACC warns that its latest monthly statistics may differ from those released earlier, because data are verified after publication: a month’s figure can change slightly after it first appears, which is one reason why the months may not add up exactly to the year-to-date total.
- Year-to-date changes. GACC’s table gives the volume and value from January to date but not their change on a year earlier; the January–August changes on this page are The Tea Trade’s calculation, and CTMA’s briefing publishes the same.
- One month is a weak signal. January and February moved in opposite directions in 2026 (−8.9% and +27.6%), so the two are worth reading together, as GACC first releases them.
- Values. GACC and MOFCOM both give values in US dollars. Unit values are declared values divided by weight; they change with the mix of teas, grades and pack sizes shipped, as well as with prices.
Questions and answers
How much tea did China export in August 2026?
28,894 tonnes worth US$119.8 million, according to China's General Administration of Customs (GACC): 18.4% less in volume and 15.2% less in value than in August 2025, but 3.1% more in volume than in July 2026. The average unit value was US$4.14 per kg (The Tea Trade's calculation).
Are China's tea exports up or down in 2026?
Down in volume, up in value. From January to August 2026, China exported 252,494 tonnes of tea (−6.1%) worth US$990.8 million (+1.4%), according to GACC figures and The Tea Trade's calculation. Volume was flat from January to April and 12.0% lower from May to August.
When are China's monthly tea export figures published?
China Customs (GACC) publishes the tea line in its Monthly Bulletin around the 18th of the following month: the table for August 2026 is dated 18 September 2026. The China Tea Marketing Association repeats the figures around the 20th. MOFCOM's reports, which add destinations, come months later: the files for March and April 2026 are dated 3 July 2026 on MOFCOM's server.
Which countries buy the most Chinese tea in 2026?
In April 2026, the latest month MOFCOM's reports covered on 14 October 2026, Morocco came first by value with 6,932 tonnes (+14.1%), ahead of Mauritania (2,936 tonnes, +48.5%) and Senegal (1,836 tonnes, −28.3%). Over January to April, Morocco, Mauritania and Côte d'Ivoire were the first three by value (MOFCOM).
What is the average export price of Chinese tea in 2026?
Customs statistics give a unit value, not a price: US$3.92 per kg from January to August 2026, 8.0% more than a year earlier, and US$4.14 per kg in August alone (The Tea Trade's calculation, value ÷ volume, from GACC and MOFCOM figures). It averages every type, grade and pack size of tea exported.
Where do these monthly tea export figures come from?
The 2026 months come from the tea line (HS 0902) of the Monthly Bulletin of China's General Administration of Customs (GACC), and the 2025 months from the monthly reports of China's Ministry of Commerce (MOFCOM), from which every year-on-year change GACC publishes for 2026 can be recalculated. For January to April 2026, MOFCOM's figures match GACC's to the tonne.
Sources
- 1. General Administration of Customs of China (GACC): (13) Major Export Commodities in Quantity and Value, January–August 2026, Monthly Bulletin (18 September 2026) · english.customs.gov.cn
- 2. GACC: Monthly Bulletin, 2026 tables, including (13) Major Export Commodities in Quantity and Value for each month from January 2026 · english.customs.gov.cn
- 3. GACC: Preliminary Release, 2026 tables · english.customs.gov.cn
- 4. GACC: Release Calendar of 2025 for Customs Statistics Data · english.customs.gov.cn
- 5. GACC: Coverage of Major Imports & Exports (lists of the HS codes behind each line, 2024) · english.customs.gov.cn
- 6. MOFCOM and 中国食品土畜进出口商会: China export monthly statistical report, tea, April 2026 (in Chinese) · wms.mofcom.gov.cn
- 7. MOFCOM and 中国食品土畜进出口商会: China export monthly statistical report, tea, February 2026 (in Chinese) · wms.mofcom.gov.cn
- 8. MOFCOM and 中国食品土畜进出口商会: China export monthly statistical report, tea, August 2025 (in Chinese) · wms.mofcom.gov.cn
- 9. MOFCOM and 中国食品土畜进出口商会: China export monthly statistical report, tea, April 2025 (in Chinese) · wms.mofcom.gov.cn
- 10. MOFCOM Department of Foreign Trade: archive of the monthly tea export reports, with the issues for each month of 2025 and for January to April 2026 (in Chinese) · wms.mofcom.gov.cn
- 11. China Tea Marketing Association (CTMA): briefing on China's tea imports and exports in August 2026, 20 September 2026 (in Chinese) · ctma.com.cn
- 12. CTMA: monthly briefings on China's tea imports and exports (in Chinese) · ctma.com.cn